Quantcast
Channel: Hidden property – Undocumented Matlab
Viewing all 30 articles
Browse latest View live

Axes LooseInset property

$
0
0

Last week, I wrote an article about the hidden/undocumented LineSmoothing plot property. This week, I want to introduce another useful hidden/undocumented property – the plot axes’ LooseInset property. This follows on the wake of an email I received from a reader about this property, which had some new information for me (thanks Ben!).

Apparently, LooseInset, which is automatically set to a factory value of [0.13, 0.11, 0.095, 0.075], is used by Matlab axes to reserve a small empty margin around the axes, presumably to enable space for tick marks. These empty margins can be very annoying at times, especially when we have directly control on the axes contents.

figure; t=0:0.01:7; plot(t,2*sin(t));

Axes with default LooseInset values (note the excessive margins)

Axes with default LooseInset values
(note the excessive margins)

If you set Position to [0 0 1 1], the labels are cut-off; if you set Position to something like [0.05 0.05 0.9 0.9], you can get the labels to show up, but if you now resize the image the labels may be cut off… Similarly, setting TightInset also does not work.

Theoretically, the solution should be to set OuterPosition to [0 0 1 1]. This is supposed to make the axes (including labels) take up the entire figure. However, it usually over-estimates the required margins, causing wasted space. Using OuterPosition also causes unexpected behaviors with sub-plots.

Solution: simply set LooseInset to [0 0 0 0]:

set(gca, 'LooseInset', [0,0,0,0]);

Axes with empty LooseInset values

Axes with empty LooseInset values

To modify all future axes in the same way (i.e., have an empty LooseInset):

set(0,'DefaultAxesLooseInset',[0,0,0,0])

Clearing the LooseInset margins has a drawback: if the axes is zoomed or modified in such a way that the labels change, then the active axes plot region needs to shrink accordingly. For example:

Axes with empty LooseInset values, wide tick labels (note the changed plot region size)

Axes with empty LooseInset values, wide tick labels
(note the changed plot region size)

When determining the size of the axes, it seems that Matlab takes into account larger of the documented TightInset and the undocumented LooseInset. So, perhaps a better generic solution would be the one suggested by another blog reader:

set(gca,'LooseInset',get(gca,'TightInset'))

Note that the LooseInset property was first reported on CSSM back in 2007 (also here). The LooseInset property has remained hidden and undocumented to this day (Matlab 7.10, R2010a), although it has even featured in an official MathWorks Technical Solution to a reported problem about unexpected axes sizes last year.

p.s. – another undocumented property of Matlab axes, ContentsVisible, was described by Matt Whittaker in a comment on my original article that introduced undocumented properties.

 
Related posts:
  1. Determining axes zoom state The information of whether or not an axes is zoomed or panned can easily be inferred from an internal undocumented object....
  2. Setting axes tick labels format Matlab plot axes ticks can be customized in a way that will automatically update whenever the tick values change. ...
  3. Plot LineSmoothing property LineSmoothing is a hidden and undocumented plot line property that creates anti-aliased (smooth unpixelized) lines in Matlab plots...
  4. Getting default HG property values Matlab has documented how to modify default property values, but not how to get the full list of current defaults. This article explains how to do this. ...
 

Plot LimInclude properties

$
0
0

Concluding my three-part mini-series on hidden and undocumented plot/axes properties, I would like to present a set of properties that I find very useful in dynamic plots: XLimInclude, YLimInclude, ZLimInclude, ALimInclude and CLimInclude. These properties, which are relevant for plot/axes objects, have an ‘on’ value by default. When set to ‘off’, they exclude their object from the automatic computation of the corresponding axes limits (XLim/YLim/ZLim/ALim/CLim).

For example, here’s a simple sine wave with a wavefront line marker. Note how the too-tall wavefront line affects the entire axes Y-limits:

cla;
t=0:.01:7.5;
plot(t,sin(t));
line('xdata',[7.5,7.5], 'ydata',[-5,5], 'color','r'); 
box off

Regular plot (YLimInclude on)

Regular plot (YLimInclude on)

This situation is quickly fixed using the YLimInclude property:

cla;
t=0:.01:7.5;
plot(t,sin(t));
line('xdata',[7.5,7.5], 'ydata',[-5,5], 'color','r', ...
     'YLimInclude','off'); 
box off

YLimInclude off

YLimInclude off

Beside the functional importance of this feature, it also has a large potential for improved application performance: I recently designed a monitor-like GUI for a medical application, where the data is constantly updated from an external sensor connected to the computer. The GUI presents the latest 10 seconds of monitored data, which bounce up and down the chart. A red wave-front line is presented and constantly updated, to indicate the current data position. Since the monitored data jumps up and down, the Y-limits of the monitor chart often changes, and with it I would need to modify the wavefront’s YData based on the updated axes YLim. This turned out to steal precious CPU time from the actual monitoring application. Came YLimInclude to the rescue, by letting me specify the wavefront line as:

hWavefront = line(..., 'YData',[-99,99], 'YLimInclude','off');

Now the wavefront line never needed to update its YData (only XData, which is much less CPU-intensive) – it always spanned the entire axes height, since [-99,99] were assured (in my particular case) to exceed the actual monitored data. This looked better (no flicker effects) and performed faster than the regular (documented) approach.

Note that although all these properties exist, to the best of my knowledge, for all Handle-Graphic plot objects, they are sometimes meaningless. For example, ZLimInclude is irrelevant for a 2D patchless plot; CLimInclude relates to the axes color limits which are irrelevant if you’re not using a colormap or something similar; ALimInclude relates to patch transparency (alpha-channel) and is irrelevant elsewhere. In these and similar cases, setting these properties, while allowed and harmless, will simply have no effect.

This concludes my mini-series of undocumented plot/axes properties. To recap, the other articles dealt with the LooseInset and LineSmoothing properties.

Have you found other similar properties or use-cases that you find useful? I will be most interested to read about them in the comments section below.

 
Related posts:
  1. Borderless button used for plot properties A borderless button can be used to add unobtrusive functionality to plot axes...
  2. Plot performance Undocumented inner plot mechanisms can be used to significantly improved plotting performance...
  3. getundoc – get undocumented object properties getundoc is a very simple utility that displays the hidden (undocumented) properties of a specified handle object....
  4. UDD Properties UDD provides a very convenient way to add customizable properties to existing Matlab object handles...
 

Matlab’s HG2 mechanism

$
0
0

A few days ago I posted a lengthy article about Matlab’s undocumented feature function. In it, I mentioned a feature called HG2, that I believe merits a dedicated article, due to its potential high impact on future Matlab releases.

HG2, which presumably stands for “Handle Graphics 2nd generation”, was already reported in the past as an undocumented hidden figure property (UseHG2). In normal Matlab usage, this boolean property is ‘off’:

>> get(gcf,'usehg2')
ans =
off

HG2 is mentioned in quite a few Matlab files:

  • clf.m, hgload.m, ishg2figure.m, datetick.m, linkdata.m, linkplotfunc.m, cameratoolbar, /bin/registry/handle_graphics.xml, /ja/xlate and many more
  • uimodemanager.m (and others) temporarily disables a ‘MATLAB:handle:hg2′ warning
  • defaulterrorcallback.m mentions ‘MATLAB:HG2:SceneNode’ and ‘MATLAB:HG2:Property’
  • getplotbrowserproptable.m mentions several special HG2 types (hg2.Line, hg2.Lineseries, hg2.Patch etc.)
  • There’s even a dedicated /toolbox/matlab/graphics/private/ishg2figure.m function that determines whether a figure contains any HG2 graphics based on the existence of ‘hg2peer’ appdata (getappdata(fig,’hg2peer’)).
  • /toolbox/matlab/plottools/@objutil/@eventmanager/schema.m (and a few others) has the following comment:
     % may contain either UDD or MCOS listeners during the hg2 migration.

Obviously, much effort was invested in HG2 functionality. The fact that HG2 has been under development at least since 2007 (when I first discovered and reported it) seems to indicate a major upheaval in Matlab’s Handle Graphics mechanism. This hunch is reinforced by cryptic comments made by MathWorks personnel over the past few years that they are indeed looking at the HG system, which in their opinion is nearing its limitations. Perhaps I’m mixing unrelated stuff here, but it does make sense in light of Matlab’s push of its OOP class system over the past few releases.

To preview this HG2 system, we need to turn it on. Unfortunately, when we set the figure’s UseHG2 to ‘on’ there doesn’t seem to be any visible effect. However, this changes after we use the corresponding ‘UseHG2′ feature using the feature function (this caused lots of nasty-looking errors in past releases but works ok in R2010a):

>> feature('usehg2',1)

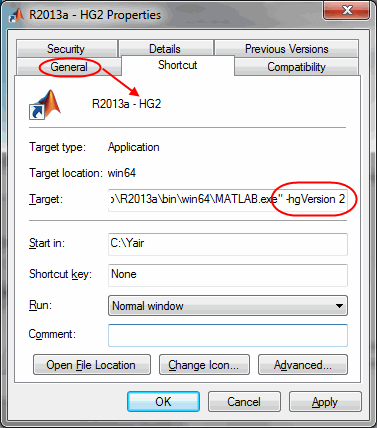
The /ja/xlate file (which is used in conjunction with the undocumented xlate function to translates Matlab messages from English to Japanese) has another key to unlocking HG2: This file contains the following message: “feature(‘useGBT2′) is only available when Matlab is started with -hgVersion 2 option.“. So let’s do as the xlate message advises and start a new Matlab session with the undocumented “-hgVersion 2″ command-line option. Now feature(‘usehg2′) is true by default and we can test the HG2 system.

Matlab looks basically the same in HG2 as in HG1. All the regular graphic functions behave just as we would expect from the existing (HG1) implementation. There are two major differences though:

  • the figure toolbars/menubars are missing and cannot be shown, even when the relevant figure properties are set. Without a menubar and toobar, Matlab figures are extremely less useful than their HG1 counterparts. This problem does not occur in HG2-enabled figures in the regular Matlab session (i.e., without using the “-hgVersion 2″ command-line option)
  • all the HG handles are now Matlab class handles rather than numeric values (These class handles are similar to those returned today (in HG1) using the undocumented handle function). There’s an exception to this rule: in regular Matlab sessions (i.e., without using the “-hgVersion 2″ command-line option), after setting the ‘UseHG2′ feature on, the returned figure handle is numeric rather than a class handle (but if you now plot within this figure you get the class object handles). Here’s the output from the “-hgVersion 2″ Matlab session:
    >> hFig = figure
    hFig = 
    	ui.Figure
     
    >> hLine = plot(1:5)
    hLine = 
    	hg2.Lineseries
     
    >> get(hLine,'Parent')
    ans = 
    	hg2.Axes
     
    >> findprop(gcf,'Tag')
    ans = 
      meta.property handle
      Package: meta
     
      Properties:
                       Name: 'Tag'
                Description: 'Tag PropInfo'
        DetailedDescription: ''
                  GetAccess: 'public'
                  SetAccess: 'public'
                  Dependent: 1
                   Constant: 0
                   Abstract: 0
                  Transient: 0
                     Hidden: 0
              GetObservable: 1
              SetObservable: 1
                   AbortSet: 0
                  GetMethod: []
                  SetMethod: []
                 HasDefault: 0
              DefiningClass: [1x1 meta.class]
      Methods, Events, Superclasses
     
    >> methods(gcf)
     
    Methods for class ui.Figure:
     
    Figure                  disp                    get                     horzcat                 lt                      subsasgn                
    addlistener             double                  getParentImpl           ishghandlewithargs      ne                      vertcat                 
    addprop                 eq                      getSceneViewer          ishghandlewoargs        notify                  
    applydefaultproperties  findobj                 getdisp                 isvalid                 reset                   
    cat                     findprop                gt                      java                    set                     
    delete                  ge                      hgclose                 le                      setdisp                 
     
    Static methods:
     
    getDefaultObject        
     
    >> methods(gcf,'-full')
     
    Methods for class ui.Figure:
     
    ui.Figure lhs1 Figure(rhs0)
    event.listener L addlistener(handle sources, char vector eventname, function_handle scalar callback)  % Inherited from hg2utils.HGHandle
    event.proplistener L addlistener(handle sources, meta.property propertyname, char vector eventname, function_handle scalar callback)  % Inherited from hg2utils.HGHandle
    event.proplistener L addlistener(handle sources, string propertyname, char vector eventname, function_handle scalar callback)  % Inherited from hg2utils.HGHandle
    event.proplistener L addlistener(handle sources, cell propertyname, char vector eventname, function_handle scalar callback)  % Inherited from hg2utils.HGHandle
    meta.property prop addprop(handle scalar object, string propname)  % Inherited from dynamicprops
    applydefaultproperties(HGHandle object, rhs1)  % Inherited from hg2utils.HGHandle
    HeterogeneousHandle lhs3 cat(double rhs0, rhs1, rhs2)  % Inherited from HeterogeneousHandle
    delete(handle obj)  % Inherited from handle
    disp(object)  % Inherited from hg2utils.HGHandle
    lhs1 double(handle object)  % Inherited from hg2utils.HGHandle
    logical TF eq(A, B)  % Inherited from hg2utils.HGHandle
    handle output findobj(handle object, varargin)  % Inherited from hg2utils.HGHandle
    meta.property prop findprop(handle scalar object, string propname)  % Inherited from handle
    logical TF ge(A, B)  % Inherited from handle
    varargout get(hgsetget object, rhs1)  % Inherited from hg2utils.HGHandle
    Static HeterogeneousHandle lhs0 getDefaultObject  % Inherited from hg2utils.HGHandle
    lhs2 getParentImpl(handle scalar object, rhs1)  % Inherited from hg2utils.HGObject
    lhs2 getSceneViewer(handle scalar object, rhs1)  % Inherited from ui.UISceneViewerParent
    getdisp(hgsetget rhs0)  % Inherited from hgsetget
    logical TF gt(A, B)  % Inherited from handle
    hgclose(handle scalar object)
    HeterogeneousHandle lhs2 horzcat(rhs0, rhs1)  % Inherited from HeterogeneousHandle
    lhs2 ishghandlewithargs(handle scalar object, rhs1)  % Inherited from hg2utils.HGObject
    lhs1 ishghandlewoargs(handle scalar object)  % Inherited from hg2utils.HGObject
    logical validity isvalid(handle obj)  % Inherited from handle
    j java(JavaVisible scalar h)  % Inherited from JavaVisible
    logical TF le(A, B)  % Inherited from handle
    logical TF lt(A, B)  % Inherited from handle
    logical TF ne(A, B)  % Inherited from hg2utils.HGHandle
    notify(handle sources, string eventname, event.EventData scalar eventdata)  % Inherited from handle
    notify(handle sources, string eventname)  % Inherited from handle
    reset(handle scalar object)  % Inherited from hg2utils.HGHandle
    varargout set(hgsetget object, rhs1)  % Inherited from hg2utils.HGHandle
    setdisp(hgsetget rhs0)  % Inherited from hgsetget
    varargout subsasgn(rhs0, rhs1, rhs2, rhs3)  % Inherited from HeterogeneousHandle
    HeterogeneousHandle lhs2 vertcat(rhs0, rhs1)  % Inherited from HeterogeneousHandle

The latest Matlab releases have shown how the Matlab handle class can be extended using user-created derived classes. It stands to reason that so do all the new HG2 objects. This would theoretically enable Matlab programmers to customize graphic objects appearance to suit their needs in a more intuitive manner than possible using HG1.

Many mysteries remain:

  • is it possible to mix HG1 and HG2 objects in the same figure?
  • can we switch between HG1 and HG2 in the same Matlab session (I got some crashes…)?
  • why is there a need for the separate feature options ‘UseHG2′, ‘UseGBT2′ and ‘HGUsingMatlabClasses’?
  • why is there a need for “-hgVersion 2″ Matlab sessions if we can simply use feature(‘UseHG2′)?
  • is it possible to restore the figure menubar and toolbar in “-hgVersion 2″ Matlab sessions?
  • is it indeed possible to extend HG2 objects using user-defined classes? and if so, can we modify the appearance/behavior beyond what is available in the existing list of HG2 properties?
  • beyond changing numeric handles into class handles, are there any actual benefits to the HG2 system over HG1?
  • what is the difference between HG2, GBT2 and GBT1.5 (which are mentioned together as separate entities in cameratoolbar.m)?

HG2 is still buggy, which explains why it is still not officially released. For example, the inspect(gca) function crashes Matlab, figure toolbars/menubars are missing, and some properties that are available in HG1 are missing in HG2. Also, we can add Java components to a Matlab figure using javacomponent as in HG1 (the returned container handles is a ui.HGJavaComponent class handle), but we get an error when we close the figure…

Still, with all this effort invested into HG2 I believe that it is only a matter of time before HG2 becomes officially released. This could happen perhaps even as soon as the upcoming R2010b release, but with the current state as seen above I suspect it will not happen before 2011. Also, my gut feeling is that Matlab will define any release that includes HG2 as a major release and we will finally have Matlab 8.0.

I would dearly love to hear any further information anyone discovers about HG2 and related issues. Please share your findings by email or in the comments section below.

 
Related posts:
  1. New information on HG2 More information on Matlab's new HG2 object-oriented handle-graphics system...
  2. Controlling plot data-tips Data-tips are an extremely useful plotting tool that can easily be controlled programmatically....
  3. Handle Graphics Behavior HG behaviors are an important aspect of Matlab graphics that enable custom control of handle functionality. ...
  4. Customizing uiundo This article describes how Matlab's undocumented uiundo undo/redo manager can be customized...
 

Tab panels – uitab and relatives

$
0
0

In the past year, readers of this blog have used its search box thousands of times. Can you guess what the top search terms are?

It turns out that 7 of the top 15 search terms relate to tables, trees and tab-panes.

These items are related in being standard GUI elements that unfortunately have very lacking support in Matlab. They all have corresponding functions in the %matlabroot%/toolbox/matlab/uitools folder, which was already introduced here as containing many unsupported GUI functions. Specifically, uitable for tables (this became supported in R2008a, but even the supported version has many important undocumented aspects); uitree and uitreenode for trees; and uitab and uitabgroup for tab-panes, which are today’s subject. Future articles will describe tables, trees and tab-panes in more detail.

uitab & uitabgroup

Like most other uitools, the uitab and uitabgroup functions are semi-documented, meaning that they have no support or doc-page, but do have readable help sections within their m-files. In our case, edit the uitab.m and uitabgroup.m files to see their help section.

Available since 2004 (R14 SP2, aka 7.0.4), Matlab’s uitabgroup uses the Matlab Java widget com.mathworks.hg.peer.UITabGroupPeer, which extends the standard javax.swing.JTabbedPane. Unlike uitable and uitree, which use actual Java objects to both store and present the data, uitabgroup only sets up the Java object to display the tabs, whereas the tab contents themselves are placed in entirely unrelated Matlab uicontainers. Matlab uses very clever double-booking to keep the Java and Matlab objects synchronized. The ability to “switch” tabs is actually a deception: in reality, a listener placed on the SelectedIndex property of the tab group causes the relevant Matlab container to display and all the rest to become hidden. Other listeners control containers’ position and size based on the tab group’s. Adding and removing tabs uses similar methods to add/remove empty tabs to the JTabbedPane. Read uitabgroup‘s schema.m for details.

A drawback of this complex mechanism is the absence of a single customizable Java object. The benefit is that it allows us to place any Matlab content within the tabs, including plot axes which cannot be added to Java containers. Had uitabgroup been a Java container, we could not add axes plots or images to its tabs. In my humble opinion, Matlab’s tab implementation is an ingenious piece of engineering.

Here’s a simple tab-group adapted from uitabgroup‘s help section:

hTabGroup = uitabgroup; drawnow;
tab1 = uitab(hTabGroup, 'title','Panel 1');
a = axes('parent', tab1); surf(peaks);
tab2 = uitab(hTabGroup, 'title','Panel 2');
uicontrol(tab2, 'String','Close', 'Callback','close(gcbf)');

(recent Matlab releases throw a warning when using this code: either add the ‘v0′ input arg to uitabgroup and uitab calls, or suppress the MATLAB:uitabgroup:MigratingFunction warning)

Here, the returned uitabgroup object hTabGroup is actually a Matlab container (deriving from uiflowcontainer) that always displays two elements: the Java tab-group, and the active Matlab uicontainer (the active tab’s contents). Understanding this, hTabGroup’s FlowDirection property becomes clear. However, it is better to use hTabGroup’s TabLocation property, which accepts ‘top’, ‘bottom’, ‘left’ and ‘right’:

TabLocation = 'top'

TabLocation = 'top'

TabLocation = 'left'

TabLocation = 'left'

Another hTabGroup property of interest is Margin, which sets the margin in pixels before each of the displayed elements – not just between them as might be expected: Increasing Margin (default=2 pixels) increases the gap between the tab group and the active tab’s contents, but also the gap between the tab group and figure edge:

TabLocation = 'bottom', Margin = 20   TabLocation = 'left', Margin = 20

Margin = 20

Tabs can be selected programmatically, by setting hTabGroup’s SelectedIndex property. Reading this property is useful when setting tab-selection callbacks using the SelectionChangeFcn property:

set(hTabGroup,'SelectionChangeFcn',@myCallbackFcn);
set(hTabGroup,'SelectedIndex',2);   % activate second tab

Edit Oct 27 2010: R2010b made a few changes to the hTabGroup properties: SelectedTab has been added (holds the handle of the selected tab, rather than its index as SelectedIndex; note that SelectedTab was added as a hidden property for some unknown reason, probably a programming mistake); the tab BackgroundColor cannot be modified (I’ll show how to bypass this limitation in a near-future article); SelectionChangeFcn callback and the SelectionChanged event have changed their names to SelectionChangeCallback and SelectionChange respectively. Note that this is one of the very rare occasions in which MathWorks have taken the trouble to notify users about changes to one of their undocumented/unsupported functions. They should be commended for this since it helps us Matlab users make better use of the product.

Additional control over the tab group’s behavior can be achieved by customizing the underlying Java object. This object is not directly exposed by uitabgroup, but can be found using the FindJObj utility, or via the hidden ApplicationData (this alternative only works on R2014a or earlier!). Remember that Java objects use 0-based indexing so tab #1 is actually the second tab. Also remember that HTML is accepted just as in any other Swing-based label:

% Get the underlying Java reference using FindJObj
jTabGroup = findjobj('class','JTabbedPane');
 
% A direct alternative for getting jTabGroup (only works up to R2014a!)
jTabGroup = getappdata(handle(hTabGroup),'JTabbedPane');
 
% Now use the Java reference to set the title, tooltip etc.
jTabGroup.setTitleAt(1,'Tab #2');
jTabGroup.setTitleAt(1,'<html><b><i><font size=+2>Tab #2');
jTabGroup.setToolTipTextAt(1,'Tab #2');
 
% Disabling tabs can only be done using the Java handle:
jTabGroup.setEnabledAt(1,0);  % disable only tab #1 (=2nd tab)
jTabGroup.setEnabled(false);  % disable all tabs

A future post will describe tab customization, including fonts, colors, icons and even addition of close buttons as in modern web browsers.

tabdlg

tabdlg is a related semi-documented and unsupported uitool that, like uitabgroup, creates a tabbed user interface. However, unlike uitabgroup, tabdlg uses plain-vanilla Matlab, without reliance on Java (well, actually all Matlab GUI controls ultimately rely on Java, but tabdlg does not use any Java beyond that). The end result looks less professional than uitabgroup, but it works even when Java does not.

tabdlg has an extensive help section, so it will not be detailed here. In brief, the input parameters specify the tab labels, dimensions, offsets, callbacks, font, default tab, sheet dimensions and parent figure. Here is a sample usage, taken from tabdlg‘s help section. This code is executed whenever tabdlg is invoked without any input arguments:

tabdlg left tab

tabdlg left tab

tabdlg right tab

tabdlg right tab

File Exchange alternatives

There are many implementations of tab panels in the Matlab File Exchange. Matlab’s official Desktop Blog had an article about one specific example, which was that week’s Peek of the Week, and relied on adjacent buttons that are easy to implement, but in my personal opinion are a far cry from our expectations of a tab panel.

Better FEX utilities are: Multiple Tab GUI, Highlight Tab Objects easily, and best of all: uitabpanel or TabPanel Constructor.

Another very recent submission was this week’s POTW. This utility gives a professional (although somewhat non-standard) look, and is very easy to program – an excellent utility indeed.

All of the numerous tab-panel FEX utilities, as well as the fact that tab-panels are one of the most searched-for terms in this website, indicate the Matlab community’s desire to have supported native-looking tab-panel GUI in Matlab. Perhaps after 6 years it is time to bring uitab and uitabgroup into the light?

 
Related posts:
  1. Uitab customizations This article shows several customizations that can be done to Matlab's undocumented tab-panels functionality...
  2. Uitab colors, icons and images Matlab's semi-documented tab panels can be customized using some undocumented hacks...
  3. Matlab layout managers: uicontainer and relatives Matlab contains a few undocumented GUI layout managers, which greatly facilitate handling GUI components in dynamically-changing figures....
  4. Syntax highlighted labels & panels Syntax-highlighted labels and edit-boxes can easily be displayed in Matlab GUI - this article explains how. ...
 

Panel-level uicontrols

$
0
0

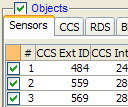
In one of my larger Matlab applications – Integration-lab Debriefing System (IDS, which shall be described in a future dedicated article) – I wanted to present a panel-level checkbox that applies to the entire panel contents. In my particular case, the IDS uipanel contained a Java table (another future topic) with multiple selectable rows, and I needed a global checkbox that selects all (or none) of them at once:

Panel-level ("Objects") checkbox

Panel-level ("Objects") checkbox

One way to do this is to calculate the checkbox’s desired position relative to the uipanel and place a regular checkbox-style uicontrol there. The checkbox can even be made a child of the uipanel with ‘normalized’ units, thereby moving and resizing it together with its uipanel parent when the later is moved or resized.

But there’s a much simpler method that want to share. It relies on the undocumented fact that the uipanel‘s title label is a simple hidden uicontrol child of the uipanel handle. This uicontrol handle can be found and simply transformed from a ‘style’='text’ control into a ‘style’='checkbox’ control, as follows:

% Prepare the panel
hPanel = uipanel('position',[0.2,0.2,0.4,0.4], 'title','Objects');
 
% Get the title label's handle
warning off MATLAB:Uipanel:HiddenImplementation  % turn off warning
hTitle = setdiff(findall(hPanel),hPanel);  % retrieve title handle
hTitle = get(hPanel,'TitleHandle');  % alternative, uses hidden prop
 
% Modify the uicontrol style; add 20 pixel space for the checkbox
newPos = get(hTitle,'position') + [0,0,20,0];  % in pixels
set(hTitle, 'style','checkbox', 'value',1, 'pos',newPos);

Panel-level checkbox

Panel-level checkbox

Note that we can retrieve the title handle using either the uipanel‘s hidden property TitleHandle, or by scanning the panel’s children using findall. I prefer the TitleHandle approach because it does not require modification (minor as it might be) when the panel already contains other children.

The down-side is that since TitleHandle is an undocumented hidden property, it may change its name, its behavior or even be removed in some future Matlab release. In fact, there’s even a Matlab warning about this, unless you turn it off using:

warning off MATLAB:Uipanel:HiddenImplementation

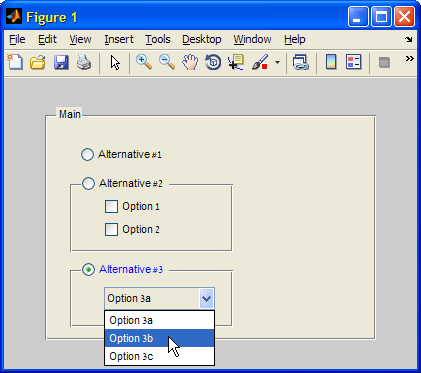
We can use this approach for more complex options panels, as the following example illustrates. Here, we set radio-button controls rather than a checkbox control, and also modify the title color to blue:

% Main panel and basic alternative control
hPanelMain = uipanel('pos',[.1,.1,.8,.8], 'Title','Main', 'units','norm');
hAlt1 = uicontrol('parent',hPanelMain, 'units','norm', 'pos',[.1,.8,.5,.1], 'style','radio', 'string','Alternative #1');
 
% Alternative options panel #2
hAlt2 = uipanel('parent',hPanelMain, 'units','norm', 'pos',[.07,.4,.5,.35], 'title','Alternative #2');
hAlt2Title = get(hAlt2, 'TitleHandle');
newPos = get(hAlt2Title,'position') + [0,0,20,0];  % in pixels
set(hAlt2Title, 'style','radio', 'pos',newPos);
hAlt2a = uicontrol('parent',hAlt2, 'units','norm', 'pos',[.2,.6,.7,.3], 'style','checkbox', 'string','Option 1');
hAlt2b = uicontrol('parent',hAlt2, 'units','norm', 'pos',[.2,.2,.7,.3], 'style','checkbox', 'string','Option 2');
 
% Alternative options panel #3
hAlt3 = uipanel('parent',hPanelMain, 'units','norm', 'pos',[.07,.05,.5,.3], 'title','Alternative #3');
hAlt3Title = get(hAlt3, 'TitleHandle');
newPos = get(hAlt3Title,'position') + [0,0,20,0];  % in pixels
set(hAlt3Title, 'style','radio', 'pos',newPos, 'ForegroundColor','blue');
hAlt3a = uicontrol('parent',hAlt3, 'units','norm', 'pos',[.2,.5,.7,.3], 'style','popup', 'string',{'Option 3a','Option 3b','Option 3c'});

Advanced panel-level controls

Advanced panel-level controls

Note that since the hAlt2Title and hAlt3Title radio-buttons are children of their respective uipanel parents, we cannot use a simple uibuttongroup to group them in a mutual-exclusion group. Instead, we must use a dedicated callback function. This is actually quite easy:

% Set the callback for all relevant radio-buttons
hButtonGroup = [hAlt1, hAlt2Title, hAlt3Title];
set(hButtonGroup, 'Callback', {@SelectionCb, hButtonGroup});
 
% This is the callback function that manages mutual exclusion
function SelectionCb(hSrc,hEvent,hButtonGroup)
   otherButtons = setdiff(hButtonGroup,hSrc);
   set(otherButtons,'value',0);
   set(hSrc,'value',1);  % needed to prevent de-selection
end

 
Related posts:
  1. Images in Matlab uicontrols & labels Images can be added to Matlab controls and labels in a variety of manners, documented and undocumented. ...
  2. Rich-contents log panel Matlab listboxes and editboxes can be used to display rich-contents HTML-formatted strings, which is ideal for log panels. ...
  3. GUI integrated HTML panel Simple HTML can be presented in a Java component integrated in Matlab GUI, without requiring the heavy browser control....
  4. Transparent uipanels Matlab uipanels can be made transparent, for very useful effects. ...
 

FIG files format

$
0
0

A short while ago, a StackOverflow user asked how to extract data from FIG files in Matlab. The answer to this question is easy, but I wish to use the opportunity to show how this can be useful in Matlab applications.

The need: load a FIG without displaying it

In data-processing applications, we often present data in graphs that can then be manipulated and saved for later use. In Matlab, saving is done interactively (via the figure’s File/Save menu option or via the figure’s Save toolbar button), or programmatically (via the hgsave function). In all cases, the data is stored in a *.FIG file (the FIG extension can actually be changed, but I really don’t see why).

The point is that in order to re-load the stored data, we need to use hgload, which has a nasty side-effect of actually displaying the stored figure.

This is bad in terms of performance and memory, especially for heavily-laden GUI figures, not to mention the fact that sometimes we do not want to display the GUI at all. We often just need to extract a sub-set of the stored information (for example, the plot values), without having to display the figure.

The answer: FIGs are simply MATs in disguise

Here’s where the undocumented stuff enters:

It seems that a FIG file is simply a hierarchical structure of all the non-default properties of the stored figure and its descendant handles, all this stored within a simple MAT file.

This is hinted in several places, for example in hgsave‘s doc page, and in the MAT-file preferences panel:

MAT-file preferences (note the FIG clarification)

MAT-file preferences (note the FIG clarification)

Knowing this, we can easily load the data, without displaying the figure, by using load(filename,’-mat’) rather than hgload. For example:

% Create and store a simple plot figure
>> figure('Name','Test #1');
>> plot(1:9, sqrt(1:9));
>> hgsave(gcf,'testFig');
 
% Load the figure data
>> d = load('testFig.fig','-mat')
d = 
    hgS_070000: [1x1 struct]   % a Matlab 7 figure
 
% Investigate the figure data
>> d.hgS_070000
ans = 
          type: 'figure'
        handle: 1
    properties: [1x1 struct]
      children: [1x1 struct]
       special: []
 
>> d.hgS_070000.children
ans = 
          type: 'axes'
        handle: 176.08251953125
    properties: [1x1 struct]
      children: [1x1 struct]
       special: [4x1 double]
 
>> d.hgS_070000.children.children
ans = 
          type: 'graph2d.lineseries'
        handle: 177.0830078125
    properties: [1x1 struct]
      children: []
       special: []
 
>> d.hgS_070000.children.children.properties
ans = 
              Color: [0 0 1]
              XData: [1 2 3 4 5 6 7 8 9]
              YData: [1 1.4142 1.7321 2 2.2361 2.4495 2.6458 2.8284 3]
    ApplicationData: [1x1 struct]
        XDataJitter: 0
          XDataMode: 'manual'
      ObeyXDataMode: 'auto'
                ...
 
% Extract plot data
>> YData = d.hgS_070000.children.children.properties.YData
YData =
  1.0000  1.4142  1.7321  2.0000  2.2361  2.4495  2.6458  2.8284  3.0000

We see a couple of interesting things in this simple example:

First, note that the top-level structure node is called “hgS_070000″ – we’ll dig into this next week. Basically, it indicates that the structure holds a Matlab 7 figure.

Secondly, we see hidden/undocumented properties of the stored objects (for example, the lineseries’ XDataJitter and ObeyXDataMode properties). ApplicationData is such a hidden handle, which is widely used as a substitute for any handle’s UserData property (the built-in setappdata and getappdata functions are simply wrappers for accessing this property using standard set and get functions).

Have you used the FIG/MAT feature for any useful functionality? If so, please do share your experience in a comment.

Next week, I will explain how looking under hgsave‘s hood leads to useful functions and to an interesting insight about Matlab’s future. Merry Christmas everybody!

 
Related posts:
  1. Setting axes tick labels format Matlab plot axes ticks can be customized in a way that will automatically update whenever the tick values change. ...
  2. Reading non-Latin text files A workaround that enables reading non-Latin text files in Matlab is shown...
  3. Plot LimInclude properties The plot objects' XLimInclude, YLimInclude, ZLimInclude, ALimInclude and CLimInclude properties are an important feature, that has both functional and performance implications....
  4. Handle Graphics Behavior HG behaviors are an important aspect of Matlab graphics that enable custom control of handle functionality. ...
 

Multi-column (grid) legend

$
0
0

I would like to welcome guest blogger Adrian Cherry. Adrian will describe a very handy utility that shows how basic built-in Matlab functions can be improved and customized by just a bit of fiddling under Matlab’s hood.

Legend Plotting

Whilst I enjoy using the many time saving features of Matlab, one area where I feel it suffers is the technical plotting and annotation. This tale relates the development of a legend plotting routine, gridLegend, in an effort to improve the presentation.

In my day job we have a requirement to condense a large quantity of data onto summary charts. However, there is only so much data consolidation possible before you start losing the information required. We often need to plot 40 or 50 lines of test data to visualize trends or outliers, using the legend to identify the number of test hours against each test specimen.

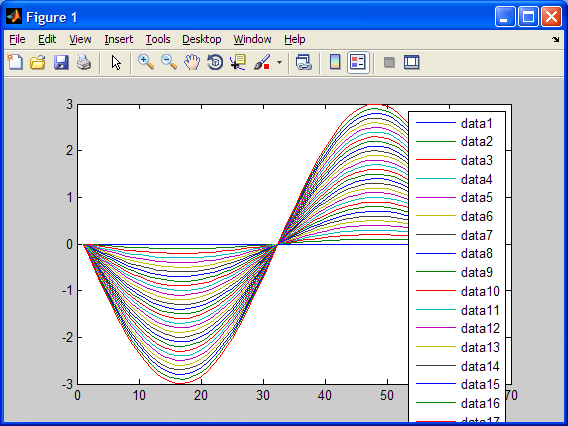
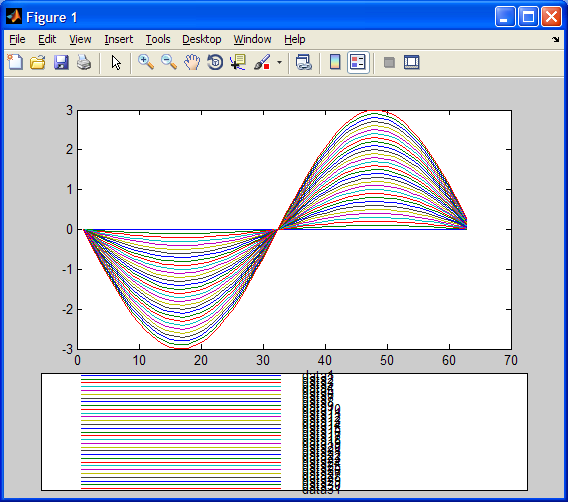
Using the standard Matlab legend function resulted in a long legend over twice the size of the associated plot:

Standard Matlab legend

Standard Matlab legend

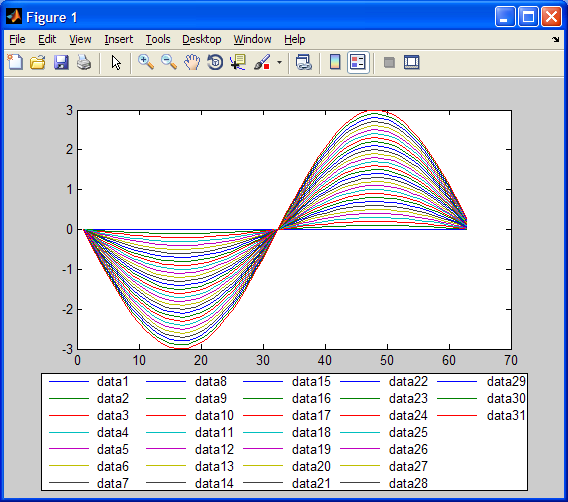
I wanted some way of generating a more compact legend format.

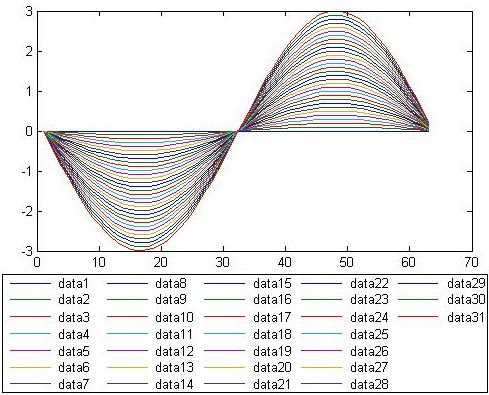
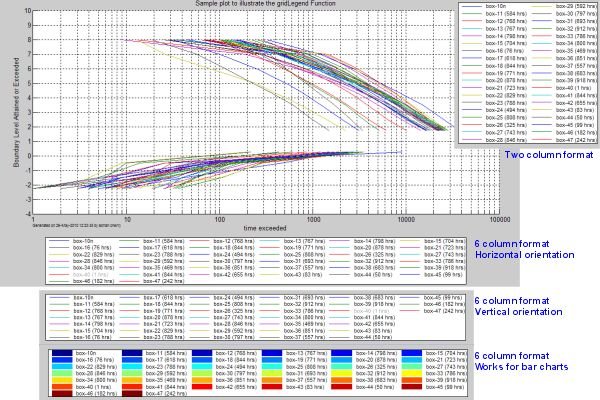
Fortunately earlier in the year, an entry on Matlab Central allowing a multi-column legend to be generated was posted, columnlegend. Although lacking some features, columnlegend gave me a good start on developing what I wanted for a multi column legend, culminating in gridLegend:

Multi-column legend

Multi-column legend

Delving into the Undocumented Matlab

So where is the link with undocumented Matlab?

As mentioned in the original columnlegend entry, it was relatively simple to redraw the legend as required on the screen. However, as soon as the figure was printed or exported to an image file, internal Matlab workings would redraw the figure, including the legend, thereby undoing my careful legend crafting, squeezing it back into one column (Yuck!):

Matlab-reverted multi-column legend

Matlab-reverted multi-column legend

As we wanted to automatically output images files, I had to delve into the hidden areas of Matlab to try to solve this problem.

My initial thought was to find out where the figure got redrawn for printing or export and override the standard legend call with a call to my new function. I couldn’t find the obvious culprit, stepping as far as I could through the print function there didn’t appear to be any call to the legend function.

In my search for information on how the legend worked I found the undocumented Matlab article about generating dynamic legends. This dynamic-legend post covered details about attaching a listener to a child of the legend axes, in Matlab the legend function creates its own set of axes on the figure to display the legend.

Armed with the information that legend axes objects could have listeners attached, I considered that these might be the source of redrawing the legend for printing. So with the legend I had generated I took a look at what listeners were attached, using the undocumented hidden axes property ScribeLegendListeners:

>> legendListener = get(gca,'ScribeLegendListeners')
legendListener = 
        fontname: [1x1 handle.listener]
        fontsize: [1x1 handle.listener]
      fontweight: [1x1 handle.listener]
       fontangle: [1x1 handle.listener]
       linewidth: [1x1 handle.listener]
         deleted: [1x1 handle.listener]
    proxydeleted: [1x1 handle.listener]

The font size and line positioning were all being redrawn for printing so this was potentially the source of my problem. However I’d not looked at a handle.listener before, so a little further digging was required:

K>> get(legendListener.fontname)
      SourceObject: [1x1 schema.prop]
         Container: [1x1 axes]
         EventType: 'PropertyPostSet'
          Callback: {2x1 cell}
    CallbackTarget: []
           Enabled: 'on'

The option Enabled immediately drew my attention, and so the following lines were added to my gridLegend function to switch off these listeners and apply it back to the legend:

LL = get(gca,'ScribeLegendListeners');
set(LL.fontname,'enabled','off');
set(LL.fontsize,'enabled','off');
set(LL.fontweight,'enabled','off');
set(LL.fontangle,'enabled','off');
set(LL.linewidth,'enabled','off');
set(gca,'ScribeLegendListeners',LL);

Finally allowing me to output the image files with a multi-column legend:

Printed multi-column legend

Printed multi-column legend

So my thanks to the contributors on Matlab Central who enabled me to get started on gridLegend and to Yair for collating the many nuggets of information on Undocumented Matlab which allowed me to complete the function and get it posted on Matlab Central.

Multi-column legend in action

Multi-column legend in action

 
Related posts:
  1. Multi-line uitable column headers Matlab uitables can present long column headers in multiple lines, for improved readability. ...
  2. Legend ‘-DynamicLegend’ semi-documented feature The built-in Matlab legend function has a very useful semi-documented feature for automatic dynamic update, which is explained here....
  3. Inactive Control Tooltips & Event Chaining Inactive Matlab uicontrols cannot normally display their tooltips. This article shows how to do this with a combination of undocumented Matlab and Java hacks....
  4. Handle Graphics Behavior HG behaviors are an important aspect of Matlab graphics that enable custom control of handle functionality. ...
 

UDD Properties

$
0
0

Donn Shull continues his series of articles on Matlab’s undocumented UDD mechanism. Today, Donn explains how to use and customize UDD properties.

Properties meta-data

The UDD system is a class system. UDD packages, classes, events, and properties are all classes. In this section we will take a closer look at property classes.

As we have already shown, properties are added to a UDD class by adding schema.prop calls to the schema.m class definition file. What this really means is that each property of a UDD class is itself a class object (schema.prop) with its own properties and methods. The methods of schema.prop are loadobj() and saveobj(), which are used to serialize objects of this class (i.e., storing them in a file or sending them elsewhere).

It is schema.prop‘s properties (so-called meta-properties) that interest us most:

PropertyData TypeDescription
AccessFlagsMatlab structureControls which objects can access (read/modify) the property
CaseSensitiveon/offDetermines if the exact case is required to access the property (i.e., can we use ‘casesensitive’ instead of ‘CaseSensitive’)
DataTypestringThe underlying object’s property data type, set by the constructor
DescriptionstringThis can hold a description of the property (normally empty)
FactoryValueAs specified by DataTypeThis is used to provide an initial or default property value
GetFunctionFunction handleA function handle that is called whenever the property value is read
NamestringThe name of the property, also set by the constructor
SetFunctionFunction handleA function handle that is called whenever the properties value is changed
Visibleon/offDetermines if a property will be displayed by the get method for a UDD object

We can manipulate the values of these meta-properties to control various aspects of our property:

% Create instance of simple.object
>> a = simple.object('a');
 
% Find the Value property and list its meta-properties
% We can manipulate these meta-properties within limits
>> a.findprop('Value').get
            Name: 'Value'
     Description: ''
        DataType: 'single'
    FactoryValue: 7.3891
     AccessFlags: [1x1 struct]
         Visible: 'on'
     GetFunction: []
     SetFunction: []
 
>> prop.Visible = 'off';  % i.e. hidden property (see below)
>> prop.AccessFlags.PublicSet = 'off';   % i.e. read-only
>> prop.AccessFlags.PublicGet = 'on';
 
% Find the DataType meta-property of the Value property
% This meta-property and all other schema.prop base class properties are fixed
>> a.findprop('Value').findprop('DataType').get
            Name: 'DataType'
     Description: ''
        DataType: 'string'
    FactoryValue: ''
           ...

Adding properties to existing objects in run-time

schema.prop is a very useful tool – it can be used to add new properties to existing object handles, even after these objects have been created. For example, let’s add a new property (MyFavoriteBlog) to a standard figure handle:

>> p=schema.prop(handle(gcf), 'MyFavoriteBlog','string')
p =
	schema.prop
 
>> set(gcf,'MyFavoriteBlog','UndocumentedMatlab.com')
 
>> get(gcf,'MyFavoriteBlog')
ans =
UndocumentedMatlab.com

Using this simple mechanism, we can add meaningful typed user data to any handle object. A similar functionality can be achieved via the setappdata/getappdata functions. However, the property-based approach above is much “cleaner” and more powerful, since we have built-in type checks, property-change event listeners and other useful goodies.

Property data types

In the article on creating UDD objects we saw that the Name and DataType meta-properties are set by the schema.prop constructor. Name must be a valid Matlab variable name (see isvarname).

DataType is more interesting: There are two equivalent universal data types, 'mxArray', and 'MATLAB array'. With either of these two data types a property can be set to a any Matlab type. If we use a more specific data type (e.g., ‘string’, ‘double’ or ‘handle’), Matlab automatically ensures the type validity whenever the property value is modified. In our simple.object we use ‘double’ and ‘string’. You can experiment with these and see that the Value property will only allow scalar numeric values and the Name property will only allow character values:

>> set(obj, 'Value', 'abcd')
??? Parameter must be scalar.
 
>> obj.Value='abcd'
??? Parameter must be scalar.
 
>> obj.Name=123
??? Parameter must be a string.

The following table lists the basic UDD data types:

CategoryData Type
UniversalMATLAB array, mxArray
Numeric Scalarsbool, byte, short, int, long, float, double
Numeric VectorsNints, NReals
Specialized Numericcolor, point, real point, real point3, rect, real rect
Enumerationon/off
Stringschar, string, NStrings, string vector
Handlehandle, handle vector, MATLAB callback, GetFunction, SetFunction
JavaAny java class recognized by Matlab

User-defined data types

While this is an extensive list, there are some obvious types missing. For example there are no unsigned integer types. To handle this UDD provides two facilities for creating your own data types. One is the schema.EnumType. As you can see, Matlab has had a form of enumerations for a really long time not just the last few releases. The other facility is schema.UserType.

With these two classes you can create any specialized data type you need. One word of caution: once you have created a new UDD data type it exists for the duration of that Matlab session. There is no equivalent of the clear classes mechanism for removing a data type. In addition once a new data type has been defined it cannot be redefined until Matlab is restarted.

Let’s use a problem discussed in the CSSM forum as example. The essence of the problem is the need to flag a graphic line object as either editable or not. The proposed proposed is to add a new Editable property to an existing line handle. We will use schema.EnumType to create a new type named 'yes/no' so that the new property could accept only ‘yes’ and ‘no’ values:

function tline = taggedLine(varargin)
%TAGGEDLINE create a line with Editable property
%
%   TLINE = TAGGEDLINE(VARARGIN) create a new handle graphics line
%   and add 'Ediatable' property to line. Default property value is 'yes'.
%
%   INPUTS:
%       VARARGIN  : property value pairs to pass to line
%
%   OUTPUTS:
%       TLINE     : hg line object with Editable property
 
    % If undefined define yes/no datatype</font>
    if isempty(findtype('yes/no'))
        schema.EnumType('yes/no', {'yes', 'no'});
    end
    tline = line(varargin{:});
    schema.prop(tline, 'Editable', 'yes/no');
end

It is necessary to test for the existence of a type before defining it, since trying to redefine a type will generate an error.

We can use this new taggedLine() function to create new line objects with the additional Editable property. Instead of adding a new property to the line class we could have defined a new class as a subclass of line:

function schema()
%SCHEMA  hg package definition function
    schema.package('hg');
end

We create our class definition as a subclass of the handle graphics line class:

function schema()
%SCHEMA  hg.taggedline class definition function
    % package definition
    superPackage = findpackage('hg');
    pkg = findpackage('hg');
 
    % class definition
    c = schema.class(pkg, 'taggedline', findclass(superPackage, 'line'));
 
    if isempty(findtype('yes/no'))
        schema.EnumType('yes/no', {'yes', 'no'});
    end
 
    % add properties to class
    schema.prop(c, 'Editable', 'yes/no');
end

And our constructor is:

function self = taggedline
%OBJECT constructor for the simple.object class
    self = hg.taggedline;
end

Here we have placed the schema.EnumType definition in the class definition function. It is usually better to place type definition code in the package definition function, which is executed prior to any of the package classes and available in all classes. But in this particular case we are extending the built-in hg package and because hg is already defined internally, our package definition code is never actually executed.

The schema.UserType has the following constructor syntax:

schema.UserType('newTypeName', 'baseTypeName', typeCheckFunctionHandle)

For example, to create a user-defined type for unsigned eight-bit integers we might use the following code:

schema.UserType('uint8', 'short', @check_uint8)
 
function check_uint8(value)
%CHECK_UINT8 Check function for uint8 type definition
    if isempty(value) || (value < 0) || (value > 255)
        error('Value must be a scalar between 0 and 255');
    end
end

Hidden properties

Visible is an 'on/off' meta-property that controls whether or not a property is displayed when using the get function without specifying the property name. Using this mechanism we can easily detect hidden undocumented properties. For example:

>> for prop = get(classhandle(handle(gcf)),'Properties')'
       if strcmpi(prop.Visible,'off'), disp(prop.Name); end
   end
 
BackingStore
CurrentKey
CurrentModifier
Dithermap
DithermapMode
DoubleBuffer
FixedColors
HelpFcn
HelpTopicMap
MinColormap
JavaFrame
OuterPosition
ActivePositionProperty
PrintTemplate
ExportTemplate
WaitStatus
UseHG2
PixelBounds
HelpTopicKey
Serializable
ApplicationData
Behavior
XLimInclude
YLimInclude
ZLimInclude
CLimInclude
ALimInclude
IncludeRenderer

Note that hidden properties such as these are accessible via get/set just as any other property. It is simply that they are not displayed when you run get(gcf) or set(gcf) – we need to specifically refer to them by their name: get(gcf,’UseHG2′). Many other similar hidden properties are described in this website.

You may have noticed that the CaseSensitive meta-property did not show up above when we used get to show the meta-properties of our Value property. This is because CaseSensitive has its own Visible meta-property set to 'off' (i.e., hidden).

Additional meta-properties

FactoryValue is used to set an initial value for the property whenever a new simple.object instance is created.

GetFunction and SetFunction were described in last week’s article, Creating a UDD Hierarchy.

AccessFlags is a Matlab structure of 'on/off' fields that control what happens when the property is accessed:

FieldnameDescription
PublicSetControls setting the property from code external to the class
PublicGetControls reading the property value from code external to the class
PrivateSetControls setting the property from internal class methods
PrivateGetControls reading the property value from internal class methods
InitControls initializing the property using FactoryValue in the class definition file
Default??? (Undocumented, no examples exist)
ResetControls initializing the property using FactoryValue when executing the built-in reset function
SerializeControls whether this object can be serialized
CopyControls whether to pass the property’s current value to a copy
ListenerControls whether property access events are generated or not
AbortSetControls whether property set events are generated when a set operation will not change the property’s value

The CaseSensitive meta-property has AccessFlag.Init = 'off'. This means that properties added to a class definition file are always case insensitive.

Another interesting fact is that properties can be abbreviated as long as the abbreviation is unambiguous. Using our simple.object as an example:

>> a = simple.object('a');
>> a.n  % abbreviation of Name
ans =
a
 
>> a.v  % abbreviation of Value
ans =
    0.0000

It is considered poor programming practice to use either improperly cased, or abbreviated names when writing code. It is difficult to read, debug and maintain. But show me a Matlab programmer who has never abbreviated Position as ‘pos’…

Note: for completeness’ sake, read yesterday’s post on MCOS properties on Loren’s blog, written by Dave Foti, author of the original UDD code. Dave’s post describes the fully-documented MCOS mechanism, which is newer than the undocumented UDD mechanism described here. As mentioned earlier, whereas UDD existed (and still exists) in all Matlab 7 releases, MCOS is only available since R2008a. UDD and MCOS co-exist in Matlab since R2008a. MCOS has definite advantages over UDD, but cannot be used on pre-2008 Matlab releases. Different development and deployment requirements may dictate using either UDD or MCOS (or both). Another pre-R2008a alternative is to use Matlab’s obsolete yet documented class system.

In the next installment of this series we will take a look at UDD events and listeners.

 
Related posts:
  1. getundoc – get undocumented object properties getundoc is a very simple utility that displays the hidden (undocumented) properties of a specified handle object....
  2. Plot LimInclude properties The plot objects' XLimInclude, YLimInclude, ZLimInclude, ALimInclude and CLimInclude properties are an important feature, that has both functional and performance implications....
  3. Performance: accessing handle properties Handle object property access (get/set) performance can be significantly improved using dot-notation. ...
  4. Displaying hidden handle properties I present two ways of checking undocumented hidden properties in Matlab Handle Graphics (HG) handles...
 

Enable/disable entire figure window

$
0
0

Some time ago, a reader on the CSSM newsgroup asked whether it is possible to disable an entire figure window while some processing is taking place. Last week, Mike posted an article about the built-in functions uiwait and uiresume on MathWork’s Matlab Desktop blog, which more-or-less answers this need. Today I will expand the answer based on several undocumented/unsupported mechanisms.

Uiwait and uiresume

We start with a short review of the supported mechanism: We can use the built-in uiwait function to suspend Matlab processing until either the specified handle (typically a figure handle) is deleted/closed, a user callback programmatically calls uiresume, or Ctrl-C is pressed. A short example, adapted from uiwait‘s help section (the official help section has a bug, so if anyone reads this at TMW, please fix):

h = uicontrol('Position', [20 20 200 40], 'String', 'Continue', 'Callback', 'uiresume(gcbf)');
f = gcf;
disp('This will print immediately');
uiwait(f); 
disp('This will print after you click Continue or close the window');
 
% Close the figure (use try-catch in case f is already closed)
try close(f); catch, end

Unfortunately, the side effect is that uiwait blocks the regular (non-callback’ed) processing until the lock is released. This is great for simple cases where we require a user to respond to a popup window (e.g., message-box or input dialog) before being allowed to proceed. In more complex situations we may wish to suspend interaction on certain figure windows while continuing to process Matlab functionality – this is impossible to do using uiwait.

Matlab does not have any documented way to disable an entire figure window. You can set the figure’s WindowStyle property to ‘modal’ but this is not the same: (1) it removes the toolbar and menu-bar (2) it still enables interaction with all the figure’s GUI controls and (3) it prevents access to any other Matlab window or desktop until the modal figure is closed. This is certainly NOT what we need.

Of course, we could always loop over all the relevant GUI handles and set their Enable property to ‘inactive’ or ‘off’. But this is tedious, lengthy, and in complex GUIs that have multiple layers of nested panels, it also requires careful recursive programming. We also need to take care to disable hidden handles, toolbars, menu-bars, context-menus, Java components – all these have different ways of being accessed and disabled. And once we uiresume from the lock, we need to remember each handle’s pre-uiwait state, so that if it was disabled before the call to uiwait, it will remain so after uiresume. In short, this is not a trivial exercise at all.

Uisuspend and uirestore

To complicate things, the fully-documented and supported uiwait and uiresume functions have the semi-documented unsupported built-in counterparts uisuspend and uirestore, which are very similar in functionality and name. It is important not to confuse between these two function sets, and most importantly, not to confuse between uiresume and uirestore after using their counterparts earlier in the code – odd things might happen if you do…

Hopefully, in a nearby Matlab release these inconsistencies between the two function sets will disappear and they will be merged, because the current situation is prone to errors and confusion. For backward compatibility considerations, I hope that uisuspend and uirestore would not be discontinued but rather be modified to simply call uiwait and uiresume.

Note that in Matlab releases up to R2010b, uirestore had a minor bug in that it overwrites the figure’s WindowScrollWheelFcn callback with the WindowKeyPressFcn value. This bug was finally fixed in R2011a.

How to enable/disable a figure window

So going back to the main question, we want to find a way to disable an entire figure window, in one simple stroke, and without blocking the Matlab processing.

As usual, we turn to Java and the solution is trivially simple:

First, get the figure window’s underlying Java reference. Note that we need the top-level container reference, rather than the proxy peer handle returned by the JavaFrame hidden property:

>> jFigPeer = get(handle(gcf),'JavaFrame')
jFigPeer =
com.mathworks.hg.peer.FigurePeer@1ffbad6
 
>> jWindow = jFigPeer.fFigureClient.getWindow
ans =
com.mathworks.hg.peer.FigureFrameProxy$FigureFrame[...]

Now remember that all Java GUI components (on which Matlab GUI is based) contain an Enabled property. So, simply set this property on the jWindow reference to true or false:

jWindow.setEnabled(false);  % or true
 
% an equivalent alternative
set(handle(jWindow),'Enabled',false)  % or true

By the way, if you only need to disable the figure’s content area (i.e., not the toolbar and menu bar), simply use a different reference handle:

jFigPeer.getFigurePanelContainer.setEnabled(false);  % or true

Notes:

  • While the window looks the same when it is disabled, in reality none of its GUI elements can be clicked or activated (try it!). If you also want the figure to appear blurred you could try using something like a JXLayer semi-translucent glass pane.
  • The Java components’ property is called Enabled, not Enable as in pure-Matlab Handle-Graphics controls. Also, the Java property expects true/false (or 0/1), rather than Matlab’s ‘on’/'off’ (there are some fine details here that are release-specific so I will skip them)
  • For docked windows the top-level window is the figure’s group container window or the desktop window, which we do not want to disable. Detecting this is easy (check whether the figure’s WindowStyle is ‘docked’), and in such cases simply disable/enable the figure’s content area as shown above.

Use of the JavaFrame property

Note that all this relies on the undocumented hidden figure property JavaFrame, which issues a standing warning (since Matlab release R2008a) of becoming obsolete in some future Matlab release (HG2?):

>> jFigPeer = get(gcf,'JavaFrame')
Warning: figure JavaFrame property will be obsoleted in a future release.
For more information see the JavaFrame resource on the MathWorks web site.
(Type "warning off MATLAB:HandleGraphics:ObsoletedProperty:JavaFrame"
to suppress this warning.) 

jFigPeer =
com.mathworks.hg.peer.FigurePeer@1ffbad6

To remove the above warning I have used (note the handle wrapper, as suggested by Donn Shull):

jFigPeer = get(handle(gcf),'JavaFrame')

If and when JavaFrame does become obsolete in some future Matlab version, be sure to look in this blog for workarounds.

You may also wish to inform MathWorks on the dedicated webpage that they have set up for specifically this reason (http://www.mathworks.com/javaframe), how you are using JavaFrame and why it is important for you. This may help them to decide whether to keep JavaFrame or possibly add the functionality using other means.

The enableDisableFig utility

In 2007, I created the enableDisableFig utility that wraps the above code in an easy-to-use Matlab utility that I have uploaded to the File Exchange.

enableDisableFig returns the current state of the specified figure handle (or gcf if no handle is specified), and optionally sets the figure’s enabled/disabled state to a new value (‘on’,'off’, true or false):

>> oldState = enableDisableFig(gcf, 'on')
oldState =
on
 
>> enableDisableFig(oldState);
>> enableDisableFig(true);  % an alternative

enableDisableFig also provides some sanity checks and error handling that should always appear in any real-world application. In this blog I generally tend to provide only bare-bones code snippets (as above). But in any respected application we must check the validity of input arguments and return values, catch run-time errors, compensate for incompatibilities with older Matlab release and so on. Take a look at enableDisableFig‘s source code to see how I have done this.

Visual aid

When any GUI control is disabled, the accepted convention is to shade it in a gray color as a visual aid to the user that the control is currently disabled. This is automatically done by Matlab when any control’s Enable property is set to ‘off’. In our case, it would be very helpful to display a similar blurring effect for the disabled figure window.

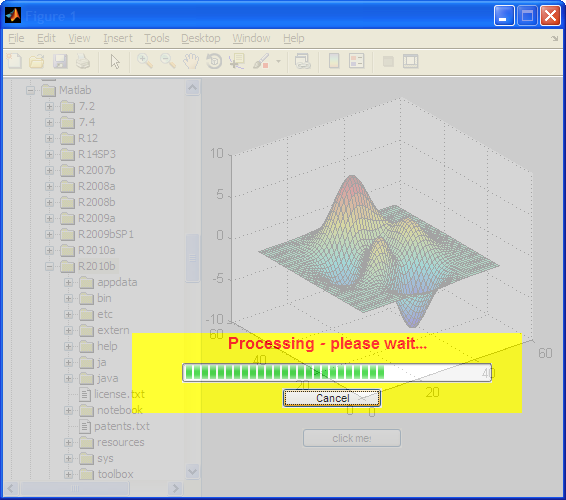
Would you be very surprised if I told you that this is impossible to do with regular Matlab, but trivially easy to achieve using a tiny bit of Java magic powder? I’ll expand on this in my next post, but here’s something to keep you waiting:

A blurred disabled figure

A blurred disabled figure

Server upgrade

This weekend (9-10 April, 2011) I plan to upgrade the website. This will entail moving to a different webserver, database, upgraded blogging application, new design etc. This site may be down or “goofy” for quite a few hours. Hopefully all will be back to normal by Monday and I hope you will like the new design.

 
Related posts:
  1. Minimize/maximize figure window Matlab figure windows can easily be maximized, minimized and restored using a bit of undocumented magic powder...
  2. Transparent Matlab figure window Matlab figure windows can be made fully or partially transparent/translucent or blurred - this article explains how...
  3. Blurred Matlab figure window Matlab figure windows can be blurred using a semi-transparent overlaid window - this article explains how...
  4. Detecting window focus events Matlab does not have any documented method to detect window focus events (gain/loss). This article describes an undocumented way to detect such events....
 

Transparent Matlab figure window

$
0
0

Every now and then, a user asks whether it is possible to make an entire Matlab window transparent (example). This could be used, for example, for window fade-in/fade-out effects. The short answer is that there is no supported way of doing this with pure documented Matlab, but it is trivially easy to achieve using just a bit of Java magic powder (surprise, surprise).

Matlab figure window transparency

Following an idea I got from Malcolm Lidierth’s MUtilities submission on the Matlab File Exchange, the solution for setting Matlab figure window transparency is quite simple: Get the figure’s underlying Java window reference handle, as in last week’s article. Then use Java’s setWindowOpacity method to set the window’s transparency value. Actually, setWindowOpacity sets the opacity level, rather than transparency, but they are obviously complementary and I personally find “transparency” to be more easily understandable.

By default, windows are created with an opacity of 1.0 (= not transparent). They can be set to any floating-point value between 0.0-1.0, where an opacity of 0.0 means full transparency, and any value in between means partial transparency (i.e., translucency):

jFigPeer = get(handle(gcf),'JavaFrame');
jWindow = jFigPeer.fFigureClient.getWindow;
com.sun.awt.AWTUtilities.setWindowOpacity(jWindow,0.7)

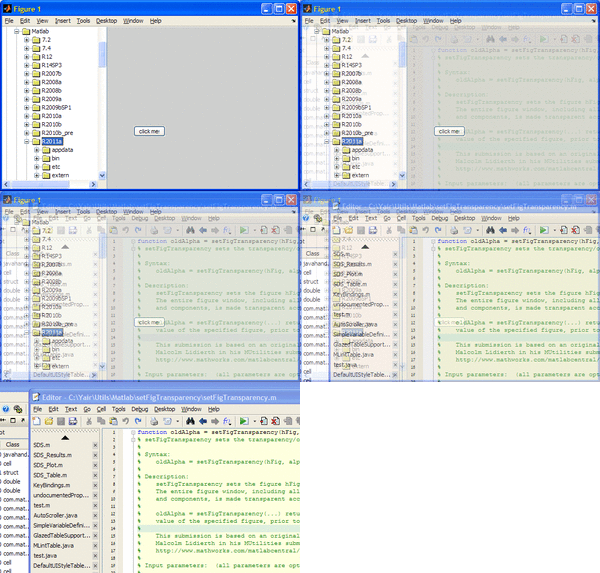
Semi-transparent (translucent) Matlab figure (click to enlarge)

Semi-transparent (translucent) Matlab figure (click to enlarge)

Similarly, you can set the entire Matlab Desktop’s transparency/opacity value:

jDesktop = com.mathworks.mde.desk.MLDesktop.getInstance.getMainFrame;
com.sun.awt.AWTUtilities.setWindowOpacity(jDesktop, 0.8);

Note that the com.sun.awt.AWTUtilities class also enables other GUI effects that would make a Matlab GUI developer’s mouth to start drooling: shaped windows, per-pixel transparency values, mirroring/reflection, window shadows, gradients etc. Perhaps I’ll explore their adaptation for Matlab figures someday.

Fade-in / fade-out

Window fade-in/fade-out effects can easily be achieved using transparency: Simply invoke the setWindowOpacity method several times, with progressively higher or lower values. This is easily done in a simple blocking loop. For example, to fade-out a window:

for stepIdx = 1 : 5
   newAlpha = 1.0 - 0.2*stepIdx;
   com.sun.awt.AWTUtilities.setWindowOpacity(jWindow,newAlpha);
   jWindow.repaint;
   pause(0.2);  % seconds
end

Gradual window fade-out

Gradual window fade-out

A more general example dynamically computes the opacity step size/duration and also enables non-blocking fade effects using an asynchronous timer:

% Compute the required opacity-setting steps
fadeDuration = 1.5;  % seconds
oldAlpha = com.sun.awt.AWTUtilities.getWindowOpacity(jWindow);
newAlpha = 0.0;
deltaAlpha = newAlpha - oldAlpha;
maxStepAlpha = 0.03;
steps = fix(abs(deltaAlpha) / maxStepAlpha) + 1;
stepAlpha = deltaAlpha / steps;
stepDuration = fadeDuration / (steps-1);
 
% If blocking, do the fade effect immediately
if blockingFlag || steps==1
   for stepIdx = 1 : steps
      newAlpha = oldAlpha + stepAlpha*stepIdx;
      com.sun.awt.AWTUtilities.setWindowOpacity(jWindow,newAlpha);
      jWindow.repaint;
      if stepIdx < steps,  pause(stepDuration);  end
   end
else
   % non-blocking: fade in/out asynchronously using a dedicated timer
   start(timer('ExecutionMode','fixedRate', 'Period',0.1, 'TasksToExecute',steps, ...
               'TimerFcn', {@timerFcn,jWindow,oldAlpha,stepAlpha}));
end
 
% Timer function for non-blocking fade-in/fade-out effect
function timerFcn(hTimer,eventData,jFrame,currentAlpha,stepAlpha)  %#ok<INUSL> eventData
  stepIdx = hTimer.TasksExecuted;
  newAlpha = currentAlpha + stepAlpha*stepIdx;
  com.sun.awt.AWTUtilities.setWindowOpacity(jFrame,newAlpha);
  jFrame.repaint;
  if stepIdx == hTimer.TasksToExecute
      stop(hTimer);
      delete(hTimer);
  end
end  % timerFcn

Of course, you can also fade-in/out to intermediate values such as 0.3 or 0.8. If you fade-out completely (i.e., to a value of 0.0), it might be a good idea to actually close the figure window once it gets the totally-transparent value of 0.0.

I’ve prepared a Matlab utility that contains all these options, including optional blocking/non-blocking fade effects, in my setFigTransparency utility, which is available for download on the Matlab File Exchange. You may also wish to use Malcolm Lidierth’s MUtilities, which also has similar functionalities (plus some other goodies).

Limitations

Setting a figure window’s transparency requires using Java Run-time Engine (JRE) 1.6.0_10 (also called “Java 6 update 10″) or higher. This means that it’s supported on Matlab release 7.9 (R2009b) and higher by default, and on earlier releases using a JRE retrofit.

If you are using an earlier Matlab release, consider a retrofit of JRE 1.6.0_10 or any later version (e.g., the latest available version today is 1.6 update 24). The JRE can be downloaded from here, and you can configure Matlab to use it according to the instructions here. As noted, Matlab R2009b (7.9) and onward, at least on Microsoft Windows, pre-bundle a JRE version that does support transparency/opacity and so do not require a retrofit.

You can check your current Java version in Matlab as follows:

>> version -java
ans =
Java 1.6.0_17-b04 with Sun Microsystems Inc. Java HotSpot(TM) Client VM mixed mode

Unfortunately, Matlab plot axes cannot be made transparent. If you have any axes in your GUI, the axes area will simply appear as a shaded axes, whose intensity depends on the selected alpha (transparency) value; the contents beneath the window will not be merged in the axes area as it is in the non-axes areas.

Finally, note that com.sun.awt.AWTUtilities is itself an undocumented Java class. It is bundled with the standard Java release since 2008 (1.6.0_10), and yet is not part of the official release because its API has not yet settled. In fact, in the upcoming Java 7 release, which is expected in a few months, and which I expect to be available in Matlab sometime in 2012, the set of transparency/opacity methods have migrated to the fully-documented java.awt.Window class.

Blurred figure window

So here’s a riddle for you: using figure window transparency, can you guess how to make a Matlab figure appear blurred for disabled figures (see the screenshot there)? There are several possible ways to do this – can you find the simplest? The first one to post a comment with a correct answer gets a smiley… My answer will appear in next week’s article.

Upgraded website

Also, did you notice my new website design? It’s supposed to be much more readable (yes – also on Android…). It now also runs on a multi-server cloud, which means more stability and faster response times. Do you like the new design? hate it? I would love to hear your feedback via comment or email.

 
Related posts:
  1. Blurred Matlab figure window Matlab figure windows can be blurred using a semi-transparent overlaid window - this article explains how...
  2. Minimize/maximize figure window Matlab figure windows can easily be maximized, minimized and restored using a bit of undocumented magic powder...
  3. Enable/disable entire figure window Disabling/enabling an entire figure window is impossible with pure Matlab, but is very simple using the underlying Java. This article explains how....
  4. Detecting window focus events Matlab does not have any documented method to detect window focus events (gain/loss). This article describes an undocumented way to detect such events....
 

Minimize/maximize figure window

$
0
0

Over the past couple of years, I posted several articles using the JavaFrame property of the figure handle, which enables access to the GUI’s underlying Java peer object. Today, I show how using JavaFrame we can solve a very frequent user request on the Matlab CSSM forum.

The problem

Matlab figures can be maximized, minimized and restored by interactively clicking the corresponding icon (or menu item) on the figure window’s frame (the title bar). However, we often need to create maximized main-application windows, and wish to save the users the need to manually maximize the window. Moreover, we may sometimes even wish to prevent users from resizing a maximized main window.

Unfortunately, Matlab does not contain any documented or supported way to programmatically maximize, minimize or restore a figure window.

This is very strange considering the fact that these are such elementary figure operations. Moreover, these operations are supported internally (and have been for many releases already), as shown below. It is therefore difficult for me to understand why they were not added to the documented Matlab HG wrapper functionality a long time ago. I fail to understand why obscure features such as docking were added to the wrapper, but standard minimization and maximization were not.

Maximization

Several solutions have been presented to this problem over the years. Let us start with the pressing question of figure maximization:

Solutions that rely on documented Matlab features tend to compute the available screen size and resize the figure accordingly. The result is lacking in many respects: it does not account for the taskbar (neither in size nor in location, which is not necessarily at the bottom of the screen); it does not remove the window border as in regular maximized figures; and it often ignores extended desktops (i.e. an attached additional monitor).

The solutions that do work properly all rely on undocumented features: Some use platform-specific native Windows API in a mex-file (Jan Simon’s recent WindowAPI submission really pushes the limit in this and other regards). Alternately, we can easily use the platform-independent JavaFrame:

>> jFrame = get(handle(gcf),'JavaFrame')
jFrame =
com.mathworks.hg.peer.FigurePeer@cdbd96
 
>> jFrame.setMaximized(true);   % to maximize the figure
>> jFrame.setMaximized(false);  % to un-maximize the figure

Minimization

To the best of my knowledge, there are no solutions for minimizing figure windows that use documented Matlab features. Again, this can be done using either native Windows API, or the platform-independent JavaFrame:

>> jFrame.setMinimized(true);   % to minimize the figure
>> jFrame.setMinimized(false);  % to un-minimize the figure

Usage notes

Maximized and Minimized are mutually-exclusive, meaning that no more than one of them can be 1 (or true) at any time. This is automatically handled – users only need to be aware that a situation in which a window is both maximized and minimized at the same time is impossible (duh!).

There are several equivalent manners of setting jFrame‘s Maximized and Minimized property values, and your choice may simply be a matter of aesthetics and personal taste:

% Three alternative possibilities of setting Maximized:
jFrame.setMaximized(true);
set(jFrame,'Maximized',true);   % note interchangeable 1< =>true, 0< =>false
jFrame.handle.Maximized = 1;

jFrame follows Java convention: the accessor method that retrieves boolean values is called is<Propname>() instead of get<Propname>. In our case: isMaximized() and isMinimized():

flag = jFrame.isMinimized;        % Note: isMinimized, not getMinimized
flag = get(jFrame,'Minimized');
flag = jFrame.handle.Minimized;

In some old Matlab releases, jFrame did not possess the Maximized and Minimized properties, and their associated accessor methods. In this case, use the internal FrameProxy which has always contained them:

>> jFrameProxy = jFrame.fFigureClient.getWindow() 
jFrameProxy =
com.mathworks.hg.peer.FigureFrameProxy$FigureFrame[fClientProxyFrame,227,25,568x502,invalid,layout=java.awt.BorderLayout,title=Figure 1,resizable,normal,defaultCloseOperation=DO_NOTHING_ON_CLOSE,...]
 
>> % Three alternative possibilities of setting Minimized:
>> jFrameProxy.setMinimized(true);
>> set(jFrameProxy,'Minimized',true);
>> jFrameProxy.handle.Minimized = true;

Using FrameProxy for figure minimization and maximization works correctly on both old and new Matlab releases; using jFrame is slightly simpler but only works on recent Matlab releases. Depending on your needs you may choose to use either of these. They are entirely equivalent.

When either the Maximized or Minimized properties are changed back to false, the window is restored to regular mode, which is the FrameProxy‘s RestoredLocation and RestoredSize.

Use of the JavaFrame property

Note that all this relies on the undocumented hidden figure property JavaFrame, which issues a standing warning (since Matlab release R2008a) of becoming obsolete in some future Matlab release (HG2?):

>> jFrame = get(gcf,'JavaFrame')
Warning: figure JavaFrame property will be obsoleted in a future release.
For more information see the JavaFrame resource on the MathWorks web site.
(Type "warning off MATLAB:HandleGraphics:ObsoletedProperty:JavaFrame" to suppress this warning.) 

jFrame =
com.mathworks.hg.peer.FigurePeer@1ffbad6

To remove the above warning I have used (note the handle wrapper, as suggested by Donn Shull):

jFrame = get(handle(gcf),'JavaFrame')

If and when JavaFrame does become obsolete in some future Matlab version, be sure to look in this blog for workarounds.

You may also wish to inform MathWorks on the dedicated webpage that they have set up for specifically this reason (http://www.mathworks.com/javaframe), how you are using JavaFrame and why it is important for you. This may help them to decide whether to keep JavaFrame or possibly add the functionality using other means.

Do you have a smart use for the figure’s minimization or maximization feature? or another use for JavaFrame? If so, please share your ideas in a comment below.

 
Related posts:
  1. Enable/disable entire figure window Disabling/enabling an entire figure window is impossible with pure Matlab, but is very simple using the underlying Java. This article explains how....
  2. Transparent Matlab figure window Matlab figure windows can be made fully or partially transparent/translucent or blurred - this article explains how...
  3. Blurred Matlab figure window Matlab figure windows can be blurred using a semi-transparent overlaid window - this article explains how...
  4. Detecting window focus events Matlab does not have any documented method to detect window focus events (gain/loss). This article describes an undocumented way to detect such events....
 

Uitable sorting

$
0
0

uitable is probably the most complex basic GUI controls available in Matlab. It displays data in a table within a figure, with settable properties as with any other Matlab Handle-Graphics (HG) control. After many years in which the uitable was available but semi-documented and not officially supported in Matlab, it finally became fully documented and supported in R2008a (aka Matlab 7.6). At that time its internal implementation has changed from a MathWorks-developed Java table to a JIDE-based Java table (another JIDE-derived table was described here last year). Since R2008a, both versions of uitable are available – the old version is available by adding the ‘v0′ input arg.

Matlab’s uitable exposes only a very limited subset of functionalities and properties to the user. Numerous other functionalities are available by accessing the underlying Java table and hidden Matlab properties. Today I will describe a very common need in GUI tables, that for some unknown reason is missing in Matlab’s uitable: Sorting table data columns.

Last week I explained how we can modify table headers of an ActiveX table control to display sorting icons. In that case, sorting was built-in the control, and the question was just how to display the sorting arrow icon. Unfortunately, Matlab’s uitable does not have sorting built-in, although it’s quite easy to add it, as I shall now show.

Old uitable sorting

The old uitable is the default control used until R2007b, or that can be selected with the ‘v0′ input arg since R2008a. It was based on an internal MathWorks extension of the standard Java Swing JTable – a class called com.mathworks.widgets.spreadsheet.SpreadsheetTable.

Users will normally try to sort columns by clicking the header. This has been a deficiency of JTable for ages. To solve this for the old (pre-R2008a) uitable, download one of several available JTable sorter classes, or my TableSorter class (available here). Add the TableSorter.jar file to your static java classpath (via edit('classpath.txt')) or your dynamic classpath (javaaddpath('TableSorter.jar')).

% Display the uitable and get its underlying Java object handle
[mtable,hcontainer] = uitable('v0', gcf, magic(3), {'A', 'B', 'C'});   % discard the 'v0' in R2007b and earlier
jtable = mtable.getTable;   % or: get(mtable,'table');
 
% We want to use sorter, not data model...
% Unfortunately, UitablePeer expects DefaultTableModel not TableSorter so we need a modified UitablePeer class
% But UitablePeer is a Matlab class, so use a modified TableSorter & attach it to the Model
if ~isempty(which('TableSorter'))
   % Add TableSorter as TableModel listener
   sorter = TableSorter(jtable.getModel());
   jtable.setModel(sorter);
   sorter.setTableHeader(jtable.getTableHeader());
 
   % Set the header tooltip (with sorting instructions)
   jtable.getTableHeader.setToolTipText('<html>&nbsp;<b>Click</b> to sort up; <b>Shift-click</b> to sort down<br />&nbsp;...</html>');
 
else
   % Set the header tooltip (no sorting instructions...)
   jtable.getTableHeader.setToolTipText('<html>&nbsp;<b>Click</b> to select entire column<br />&nbsp;<b>Ctrl-click</b> (or <b>Shift-click</b>) to select multiple columns&nbsp;</html>');
end

Sorted uitable - old version

Sorted uitable - old version

New uitable sorting

The new uitable is based on JIDE’s com.jidesoft.grid.SortableTable and so has built-in sorting support – all you need to do is to turn it on. First get the underlying Java object using my FindJObj utility:

% Display the uitable and get its underlying Java object handle
mtable = uitable(gcf, 'Data',magic(3), 'ColumnName',{'A', 'B', 'C'});
jscrollpane = findjobj(mtable);
jtable = jscrollpane.getViewport.getView;
 
% Now turn the JIDE sorting on
jtable.setSortable(true);		% or: set(jtable,'Sortable','on');
jtable.setAutoResort(true);
jtable.setMultiColumnSortable(true);
jtable.setPreserveSelectionsAfterSorting(true);

Note: the Matlab mtable handle has a hidden Sortable property, but it has no effect – use the Java property mentioned above instead. I assume that the hidden Sortable property was meant to implement the sorting behavior in R2008a, but MathWorks never got around to actually implement it, and so it remains this way to this day.

A more detailed report

I have prepared a 30-page report about using and customizing Matlab’s uitable, which greatly expands on the above. This report is available for a small fee here (please allow up to 48 hours for email delivery). The report includes the following (more details here):

  • comparison of the old vs. the new uitable implementations
  • description of the uitable properties and callbacks
  • alternatives to uitable using a variety of technologies
  • updating a specific cell’s value
  • setting background and foreground colors for a cell or column
  • using dedicated cell renderer and editor components
  • HTML processing
  • setting dynamic cell-specific tooltip
  • setting dynamic cell-specific drop-down selection options
  • using a color-selection drop-down for cells
  • customizing scrollbars
  • customizing column widths and resizing
  • customizing selection behavior
  • data sorting (expansion of today’s article)
  • data filtering (similar to Excel’s data filtering control)
  • merging table cells
  • programmatically adding/removing rows
  • numerous links to online resources
  • overview of the JIDE grids package, which contains numerous extremely useful GUI controls and components

 
Related posts:
  1. Uitable customization report Matlab's uitable can be customized in many different ways. A detailed report explains how. ...
  2. Uitable cell colors A few Java-based customizations can transform a plain-looking data table into a lively colored one. ...
  3. Multi-line uitable column headers Matlab uitables can present long column headers in multiple lines, for improved readability. ...
  4. treeTable A description of a sortable, groupable tree-table control that can be used in Matlab is provided. ...
 

Controlling plot data-tips

$
0
0

Plot data tips are a great visualization aid for Matlab plots. They enable users to interactively click on a plot location and see a tool-tip that contains the clicked location’s coordinates. The displayed tooltip text is even customizable using documented properties of the datacursormode object.

plot data tips

plot data tips

A client has recently asked me to automatically display an attached data-tip to the last data point of a plotted time series of values. The idea was to immediately see what the latest value of the data series is.

Unfortunately, the official documentation clearly says that:

You place data tips only by clicking data objects on graphs. You cannot place them programmatically (by executing code to position a data cursor).

Well, this has never stopped us before, has it?

Creating new data tips

Under the hood, data tips use a data-cursor mode, which shares many similarities in behavior and programming code with the other plot modes (zoom, pan, data-brushing, etc.). At any one time, only a single such mode can be active in any figure window (this is a known limitation of the design). The code itself it actually quite complex and handles numerous edge-cases. Understanding it by simply reading the code (under %matlabroot%\toolbox\matlab\graphics\) is actually pretty difficult. A much easier way to understand the programming flow is to liberally distribute breakpoints (start in datacursormode.m) and interactively activate the functionality, then debug the code step-by-step.

Luckily, it turns out that the code to create a new data-tip is actually quite simple: first get the data-cursor mode object, then create a new data tip using the mode’s createDatatip() method, update some data-tip properties and finally update the data-tip’s position:

% First plot the data
hLine = plot(xdata, ydata);
 
% First get the figure's data-cursor mode, activate it, and set some of its properties
cursorMode = datacursormode(gcf);
set(cursorMode, 'enable','on', 'UpdateFcn',@setDataTipTxt, 'NewDataCursorOnClick',false);
% Note: the optional @setDataTipTxt is used to customize the data-tip's appearance
 
% Note: the following code was adapted from %matlabroot%\toolbox\matlab\graphics\datacursormode.m
% Create a new data tip
hTarget = handle(hLine);
hDatatip = cursorMode.createDatatip(hTarget);
 
% Create a copy of the context menu for the datatip:
set(hDatatip,'UIContextMenu',get(cursorMode,'UIContextMenu'));
set(hDatatip,'HandleVisibility','off');
set(hDatatip,'Host',hTarget);
set(hDatatip,'ViewStyle','datatip');
 
% Set the data-tip orientation to top-right rather than auto
set(hDatatip,'OrientationMode','manual');
set(hDatatip,'Orientation','top-right');
 
% Update the datatip marker appearance
set(hDatatip, 'MarkerSize',5, 'MarkerFaceColor','none', ...
              'MarkerEdgeColor','k', 'Marker','o', 'HitTest','off');
 
% Move the datatip to the right-most data vertex point
position = [xdata(end),ydata(end),1; xdata(end),ydata(end),-1];
update(hDatatip, position);

Note: If you don’t like messing with the code, consider using Tim Farajian’s MakeDataTip utility, which basically does all this behind the scenes. It is much easier to use as a stand-alone utility, although it does not give you the flexiblility with all the data-tip properties as in the code above.

Updating an existing data tip

To modify the appearance of a data-tip, we first need to get access to the hDatatip object that we created earlier, either programmatically, or interactively (or both). Since we can access pre-stored handles only of programmatically-created (not interactively-created) data-tips, we need to use a different method. There are actually two ways to do this:

The basic way is to search the relevant axes for objects that have Tag=’DataTipMarker’. For each data-tip, we will get two such handles: one for the marker (Type=’line’) and the other for the text box tooltip (Type=’text’). We can use these to update (for example) the marker size, color and style; and the text’s font, border and colors.

A better way is to access the graphics.datatip object itself. This can be done using two hidden properties of the datacursormode object:

% Get the list of all data-tips in the current figure
>> cursorMode = datacursormode(gcf)
cursorMode =
	graphics.datacursormanager
 
>> cursorMode.DataCursors
ans =
	graphics.datatip: 2-by-1
 
>> cursorMode.CurrentDataCursor
ans =
	graphics.datatip
 
>> cursorMode.CurrentDataCursor.get
            Annotation: [1x1 hg.Annotation]
           DisplayName: ''
           HitTestArea: 'off'
          BeingDeleted: 'off'
         ButtonDownFcn: []
              Children: [2x1 double]
              Clipping: 'on'
             CreateFcn: []
             DeleteFcn: []
            BusyAction: 'queue'
      HandleVisibility: 'off'
               HitTest: 'off'
         Interruptible: 'on'
                Parent: 492.005493164063
    SelectionHighlight: 'on'
                   Tag: ''
                  Type: 'hggroup'
              UserData: []
              Selected: 'off'
             FontAngle: 'normal'
              FontName: 'Helvetica'
              FontSize: 8
             FontUnits: 'points'
            FontWeight: 'normal'
             EdgeColor: [0.8 0.8 0.8]
       BackgroundColor: [1 1 0.933333333333333]
             TextColor: [0 0 0]
                Marker: 'o'
            MarkerSize: 5
       MarkerEdgeColor: 'k'
       MarkerFaceColor: 'none'
       MarkerEraseMode: 'normal'
             Draggable: 'on'
                String: {'Date: 01/09/11'  'Value: 573.24'}
               Visible: 'on'
             StringFcn: []
             UpdateFcn: []
         UIContextMenu: [1x1 uicontextmenu]
                  Host: [1x1 graph2d.lineseries]
           Interpolate: 'off'

We can see that the returned graphics.datatip object includes properties of both the text-box and the marker, making it easy to modify. Moreover, we can use its aforementioned update method to move the datatip to a different plot position (see example in the code above). In addition, we can also use the self-explanatory getCursorInfo(), getaxes(), makeCurrent(), movetofront() methods, and a few others.

Cursor mode and data-tip properties

The graphics.datacursormanager and the graphics.datatip objects have several public properties that we can use:

>> cursorMode.get
              Enable: 'off'
    SnapToDataVertex: 'on'
        DisplayStyle: 'datatip'
           UpdateFcn: @setDataTipTxt
              Figure: [1x1 figure]
 
>> cursorMode.CurrentDataCursor.get
            Annotation: [1x1 hg.Annotation]
           DisplayName: ''
           HitTestArea: 'off'
      ... % See the list above

Both these objects have plenty of additional hidden properties. You can inspect them using my uiinspect utility. Here is a brief list for reference (R2011b):

graphics.datacursormanager:

  • CurrentDataCursor
  • DataCursors
  • Debug
  • DefaultExportVarName
  • DefaultPanelPosition
  • EnableAxesStacking
  • EnableZStacking
  • ExternalListeners
  • HiddenUpdateFcn
  • NewDataCursorOnClick
  • OriginalRenderer
  • OriginalRendererMode
  • PanelDatatipHandle
  • PanelHandle
  • PanelTextHandle
  • UIContextMenu
  • UIState
  • ZStackMinimum

graphics.datatip:

  • ALimInclude
  • ApplicationData
  • Behavior
  • CLimInclude
  • DataCursorHandle
  • DataManagerHandle
  • Debug
  • DoThrowStartDragEvent
  • EmptyArgUpdateFcn
  • EnableAxesStacking
  • EnableZStacking
  • EraseMode
  • EventObject
  • ExternalListenerHandles
  • HelpTopicKey
  • HostAxes
  • HostListenerHandles
  • IncludeRenderer
  • Invalid
  • IsDeserializing
  • MarkerHandle
  • MarkerHandleButtonDownFcn
  • Orientation
  • OrientationMode
  • OrientationPropertyListener
  • OriginalDoubleBufferState
  • PixelBounds
  • PointsOffset
  • Position
  • SelfListenerHandles
  • Serializable
  • TextBoxHandle
  • TextBoxHandleButtonDownFcn
  • Version
  • ViewStyle
  • XLimInclude
  • YLimInclude
  • ZLimInclude
  • ZStackMinimum
  • uistate

As can be seen, if we really want, we can always use the MarkerHandle or TextBoxHandle directly.

Deleting data tips

To delete a specific data-tip, simply call the cursor mode’s removeDataCursor() method; to delete all data-tips, call its removeAllDataCursors() method:

% Delete the current data-tip
cursorMode.removeDataCursor(cursorMode.CurrentDataCursor)
 
% Delete all data-tips
cursorMode.removeAllDataCursors()

Have you used plot data-tips in some nifty way? If so, please share your experience in a comment below.

p.s. – did you notice that Java was not mentioned anywhere above? Mode managers use pure-Matlab functionality.

 
Related posts:
  1. Draggable plot data-tips Matlab's standard plot data-tips can be customized to enable dragging, without being limitted to be adjacent to their data-point. ...
  2. Accessing plot brushed data Plot data brushing can be accessed programmatically using very simple pure-Matlab code...
  3. Plot LineSmoothing property LineSmoothing is a hidden and undocumented plot line property that creates anti-aliased (smooth unpixelized) lines in Matlab plots...
  4. Plot LimInclude properties The plot objects' XLimInclude, YLimInclude, ZLimInclude, ALimInclude and CLimInclude properties are an important feature, that has both functional and performance implications....
 

getundoc – get undocumented object properties

$
0
0

Last week, I presented the list of undocumented properties available in Matlab’s cursor mode and data-tip objects. Over the past two years, I had posted quite a few other articles on this website that used such undocumented properties. So today I will show exactly how such properties can be discovered.

Hidden properties are object properties that for some reason or other MathWorks has decided not to expose to the general public. They can still be used by Matlab users, just like any other regular property. But if you use the built-in get and set functions to list the object’s properties, you will not find the hidden properties listed. You need to know the hidden properties’ exact name in order to use them. Which is where today’s post can help, by showing you how to list these hidden properties. I wrote about this a couple of years ago, and today’s article will expand on that original post.

Hidden properties are by their very nature undocumented and not officially supported. For this reason, you should take extra care when relying on them in your code. They could change functionality or even be removed without prior notice in any future Matlab release. Still, some of these properties enable very important functionality, as I have often shown on this website.

HideUndocumented

There are two distinct manners by which undocumented properties can be seen in Matlab. The simplest was reported by Hans Olsson all the way back in 1997, in one of the very earliest posts on the CSSM newsgroup (there is no earlier public report, as far as I could tell). Since then, this method was mentioned in about a dozen other CSSM posts.

By setting the Matlab root (handle 0)’s HideUndocumented property to ‘off’ (default=’on’), subsequent calls to the built-in get and set functions list the hidden properties in addition to the regular ones. Note that HideUndocumented is itself a hidden property, which is why Hans’ post is so important – he presented us with the loose end that then enabled us to untangle the hidden properties in any other HG object.

Here is a simple example, showing HideUndocumented‘s effect on the root (handle 0) object handle itself (hidden properties are highlighted):

% Display only regular properties
>> get(0)
	CallbackObject = []
	CommandWindowSize = [86 51]
	CurrentFigure = []
	Diary = off
	DiaryFile = diary
	Echo = off
	FixedWidthFontName = Courier New
	Format = longG
	FormatSpacing = compact
	Language = he_il
	MonitorPositions = [ (2 by 4) double array]
	More = off
	PointerLocation = [1084 590]
	RecursionLimit = [500]
	ScreenDepth = [32]
	ScreenPixelsPerInch = [96]
	ScreenSize = [1 1 1440 900]
	ShowHiddenHandles = off
	Units = pixels
 
	BeingDeleted = off
	ButtonDownFcn = 
	Children = []
	Clipping = on
	CreateFcn = 
	DeleteFcn = 
	BusyAction = queue
	HandleVisibility = on
	HitTest = on
	Interruptible = on
	Parent = []
	Selected = off
	SelectionHighlight = on
	Tag = 
	Type = root
	UIContextMenu = []
	UserData = []
	Visible = on
 
% Display ALL properties (including hidden ones, which are highlighted below)
>> set(0,'HideUndocumented','off')
>> get(0)
	BlackAndWhite = off	CallbackObject = []
	CommandWindowSize = [86 51]
	CurrentFigure = []
	Diary = off
	DiaryFile = diary
	Echo = off
	ErrorMessage = [ (1 by 79) char array]	FixedWidthFontName = Courier New
	Format = longG
	FormatSpacing = compact
	HideUndocumented = off	Language = he_il
	MonitorPositions = [ (2 by 4) double array]
	More = off
	PointerLocation = [1022 82]
	PointerWindow = [0]	RecursionLimit = [500]
	ScreenDepth = [32]
	ScreenPixelsPerInch = [96]
	ScreenSize = [1 1 1440 900]
	ShowHiddenHandles = off
	Units = pixels
	AutomaticFileUpdates = on 
	BeingDeleted = off
	PixelBounds = [0 0 0 0]	ButtonDownFcn = 
	Children = []
	Clipping = on
	CreateFcn = 
	DeleteFcn = 
	BusyAction = queue
	HandleVisibility = on
	HelpTopicKey = 	HitTest = on
	Interruptible = on
	Parent = []
	Selected = off
	SelectionHighlight = on
	Serializable = on	Tag = 
	Type = root
	UIContextMenu = []
	UserData = []
	ApplicationData = [ (1 by 1) struct array]	Behavior = [ (1 by 1) struct array]	Visible = on
	XLimInclude = on	YLimInclude = on	ZLimInclude = on	CLimInclude = on	ALimInclude = on	IncludeRenderer = on

Property definitions

An entirely different mechanism uses the schema.prop definitions that were presented here by Donn Scull at the beginning of 2011. The idea is to get the object’s classhandle reference, from it to get the list of properties definitions, and for each property look at its Visible meta-property: hidden properties will simply have Visible=’off’, whereas regular properties will have ‘on’.

It turns out that there is not always a full correspondence between these two mechanism. I can’t remember specific examples, and perhaps these were fixed in the latest Matlab releases. It doesn’t matter, because merging the list of hidden properties reported by these two methods is always safe to do. Which is exactly what my getundoc utility does:

getundoc utility

The getundoc utility is based on another utility by the same name, posted by Duane Hanselman to the Matlab File Exchange in 2006 (Duane has elected to remove all his submissions from FEX a year or two ago, but that’s an entirely separate [and extremely heated] topic for a different discussion). Duane’s original getundoc utility relied only on the first (HideUndocumented) mechanism.

I have since expanded this utility to include support for the second mechanism, as well as support for the upcoming HG2 (see below). The updated getundoc is now available for download on the File Exchange. Since it’s a very short utility, I will digress from my norm and simply present its code, in its present form, here:

function c = getundoc(arg)
%GETUNDOC Get Undocumented Object Properties.
% GETUNDOC('OBJECT') or GETUNDOC(H) returns a structure of
% undocumented properties (names & values) for the object having handle
% H or indentified by the string 'OBJECT'.
%
% For example, GETUNDOC('axes') or GETUNDOC(gca) returns undocumented
% property names and values for the axes object.
 
% Extension of Duane Hanselman's original utility (which is no longer
% available on the File Exchange):
% D.C. Hanselman, University of Maine, Orono, ME 04469
% MasteringMatlab@yahoo.com
% Mastering MATLAB 7
% 2006-01-06
 
if nargin~=1
   error('One Input Required.')
end
if ischar(arg) % GETUNDOC('OBJECT')
   switch lower(arg)
   case 'root'                                                       % root
      h=0;
      hf=0;
   case 'figure'                                                   % figure
      h=figure('Visible','off');
      hf=h;
   otherwise                          % some other string name of an object
      hf=figure('Visible','off');
      object=str2func(arg);
      try
         h=object('Parent',hf,'Visible','off');
      catch
         error('Unknown Object Type String Provided.')         
      end
   end
elseif ishandle(arg) % GETUNDOC(H)
   h=arg;
   hf=0;
else
   error('Unknown Object Handle Provided.')
end
 
wstate=warning;
warning off                                      % supress warnings about obsolete properties
try set(0,'HideUndocumented','off'); catch; end  % Fails in HG2
undocfnames=fieldnames(get(h));                  % get props including undocumented
try set(0,'HideUndocumented','on'); catch; end   % Fails in HG2
docfnames=fieldnames(get(h));                    % get props excluding undocumented
 
% Yair 18/3/2010 - add a few more undocs:
try
    % This works in HG1
    props = get(classhandle(handle(h)),'properties');
    undocfnames = [undocfnames; get(props(strcmp(get(props,'Visible'),'off')),'Name')];
catch
    % Yair 18/9/2011: In HG2, the above fails, so use the following workaround:
    try
        prop = findprop(handle(h),undocfnames{1});
        props = prop.DefiningClass.PropertyList;
        undocfnames = [undocfnames; {props.Name}'];   % {props([props.Hidden]).Name}
    catch
        % ignore...
    end
end
 
c = setdiff(undocfnames,docfnames);      % extract undocumented
 
% Get the values in struct format, if relevant
if ~isempty(c)
  s = struct;
  for fieldIdx = 1 : length(c)
      try
          fieldName = c{fieldIdx};
          s.(fieldName) = get(h,fieldName);
      catch
          s.(fieldName) = '???';
      end
  end
  c = s;
end
% Yair end
 
if hf~=0                     % delete hidden figure holding selected object
   delete(hf)
end
warning(wstate)

Usage of this utility is extremely simple:

>> getundoc(0)
ans = 
             ALimInclude: 'on'
         ApplicationData: [1x1 struct]
    AutomaticFileUpdates: 'on'
                Behavior: [1x1 struct]
           BlackAndWhite: 'off'
             CLimInclude: 'on'
            ErrorMessage: [1x79 char]
            HelpTopicKey: ''
        HideUndocumented: 'on'
         IncludeRenderer: 'on'
             PixelBounds: [0 0 0 0]
           PointerWindow: 0
            Serializable: 'on'
             XLimInclude: 'on'
             YLimInclude: 'on'
             ZLimInclude: 'on'
 
>> getundoc(gcf)
ans = 
               ALimInclude: 'on'
    ActivePositionProperty: 'position'
           ApplicationData: [1x1 struct]
              BackingStore: 'on'
                  Behavior: [1x1 struct]
               CLimInclude: 'on'
                CurrentKey: ''
           CurrentModifier: {1x0 cell}
                 Dithermap: [64x3 double]
             DithermapMode: 'manual'
              DoubleBuffer: 'on'
            ExportTemplate: []
               FixedColors: [3x3 double]
                   HelpFcn: ''
              HelpTopicKey: ''
              HelpTopicMap: ''
           IncludeRenderer: 'on'
                 JavaFrame: [1x1 com.mathworks.hg.peer.HG1FigurePeer]
               MinColormap: 64
             OuterPosition: [436 374 568 502]
               PixelBounds: [0 0 560 420]
             PrintTemplate: []
              Serializable: 'on'
                    UseHG2: 'off'
                WaitStatus: []
               XLimInclude: 'on'
               YLimInclude: 'on'
               ZLimInclude: 'on'

Fixes for HG2

Unfortunately, in the new HG2 (which is still not in production, but we must be prepared, mustn’t we?), the original mechanism above (HideUndocumented) fails completely (there is no such property in the new matlab.ui.root object), whereas the second mechanism (UDD property defs) needs to be modified: Apparently, classhandle fails for HG2 object handles. Instead, we use the workaround of using findprop to get the property definition for any regular property, then get its parent (the requested class definition), and then down again to list all available properties. Note that in HG2, the relevant meta-property is Hidden which holds logical (true/false) values, as opposed to Visible and ‘off’/'on’ values for HG1 above.

All of these fixes are now incorporated in the getundoc code that is listed above.

When comparing the list of hidden properties in the existing HG1 and the new HG2, we see many interesting differences. And yes: the figure’s JavaFrame property was indeed removed in HG2. Bummer! (don’t worry – there are several workarounds up my sleeve…)

Do you have any favorite hidden property that you use in your code? If so, please tell us about it in a comment below.

p.s. – For all the numerous good people telling me about cprintf – Yes: I am aware that the latest R2011b release has broken cprintf‘s functionality. I plan to release a workaround sometime soon, when I have some spare time. I’ll keep everybody posted of course. Please be patient. (if you can’t wait, you can always hire me to fix it sooner; otherwise I need to give priority to my paying clients…)

 
Related posts:
  1. Undocumented cursorbar object Matlab's internal undocumented graphics.cursorbar object can be used to present dynamic data-tip cross-hairs...
  2. Accessing private object properties Private properties of Matlab class objects can be accessed (read and write) using some undocumented techniques. ...
  3. UDD Properties UDD provides a very convenient way to add customizable properties to existing Matlab object handles...
  4. Plot LimInclude properties The plot objects' XLimInclude, YLimInclude, ZLimInclude, ALimInclude and CLimInclude properties are an important feature, that has both functional and performance implications....
 

Determining axes zoom state

$
0
0

A couple of days ago, a reader of Matlab’s official Desktop blog asked whether it is possible to determine if an axes has been zoomed or not.

I have encountered this question myself some time ago, when I tried to customize a radar plot: The grid in radar plots does not automatically re-draw when the plot is zoomed, as in regular rectangular plots. Instead, the radial (angle) and circular (range) grid lines are statically painted when the plot is created, and remain fixed when the plot is zoomed or panned. Therefore, if we zoom in on a small-enough plot segment, we will not see any grid lines at all. It would be beneficial to repaint the grid-lines upon every zoom and pan event. I will not dive into the details today, but the important thing for today’s article is that the algorithm needed to know whether or not the axes is currently zoomed or not.

The official response is that this information is not readily available. We could of course store the axes limits somewhere and then compare them to the current limits in run-time. This will cause complications if the plotted data (and thereby the axes limits) change automatically during program use, even without any zooming/panning. It is also problematic if the user resets the zoom limits (as Jiro has correctly pointed out).

Today I’ll highlight another possible solution, that perhaps not many Matlab users are familiar with: Apparently, whenever zooming or panning occur, a hidden ApplicationData object is automatically added to the affected axes, with information about the original axes meta-data: limits, aspect ratio, camera info and view angles. This object is also automatically updated whenever we use zoom reset to reset the zoom limits.

So basically, all we have to do in run-time is to compare our current access limits with the stored info: if they are the same (or if the app-data object is missing) then the plot is unzoomed and unpanned; otherwise it is. So simple.

origInfo = getappdata(gca, 'matlab_graphics_resetplotview');
if isempty(origInfo)
   isZoomed = false;
elseif isequal(get(gca,'XLim'), origInfo.XLim) && ...
       isequal(get(gca,'YLim'), origInfo.YLim) && ...
       isequal(get(gca,'ZLim'), origInfo.ZLim)
   isZoomed = false;
else
   isZoomed = true;
end

This still does not solve the problem of limit changes when the plot data is changed, but it may perhaps be a bit easier to use than manually storing the limits before plotting. (And yes, of course the if-else statement above could be made a one-liner logical construct, but I think this way is more readable).

Zooming and panning add some additional data to ApplicationData, and also use/modify some other hidden properties of the axes handle (use the getundoc function to see them). If you use one of them for any useful purpose, please report your usage in a comment below.

 
Related posts:
  1. Axes LooseInset property Matlab plot axes have an undocumented LooseInset property that sets empty margins around the axes, and can be set to provide a tighter fit of the axes to their surroundings....
  2. Setting axes tick labels format Matlab plot axes ticks can be customized in a way that will automatically update whenever the tick values change. ...
  3. Tri-state checkbox Matlab checkboxes can easily be made to support tri-state functionality....
  4. Recovering previous editor state Recovering the previous state of the Matlab editor and its loaded documents is possible using a built-in backup config file. ...
 

uiinspect

$
0
0

After several years in which I have mentioned my uiinspect utility in posts, I figured it is high time to actually describe this utility in detail.

uiinspect in action (Java, HG, COM)

uiinspect in action (Java, HG, COM)

uiinspect, downloadable from the Matlab file Exchange, is a Matlab GUI utility that inspects the specified object and provides detailed information about its super-classes, methods, properties, static fields and callbacks in a unified Matlab window. uiinspect works on a very wide variety of inputs: Matlab/Java/Dot-Net class names and class objects; COM/DCOM objects, Handle Graphics handles etc.

In essence, uiinspect incorporates the information presented by the following built-in Matlab functions: inspect, get, and methodsview. uiinspect also presents additional aspects that are not available in any built-in Matlab function (for example, inheritance information, undocumented hidden properties, properties meta-data, grouping of callbacks by type).

uiinspect displays hidden properties and fields that are not normally displayed in Matlab (see my related getundoc utility). Property meta-data such as type, accessibility, visibility and default value are also displayed. Object properties and callbacks may be modified interactively within the uiinspect window.

Of over 40 utilities that I have so-far submitted to the File Exchange, uiinspect is one of my most complex (together with findjobj). It has undergone 24 revisions since its initial release in 2007. The latest revision has nearly 3000 source-code lines, of which 75% are code lines, 20% are comment lines and the rest are empty spacer lines. That’s a pretty complex utility to describe, and it relies on plenty of undocumented aspects, so today’s post will only highlight the important aspects. Readers are more than welcome to have a look at the source code for additional details. It is pretty-well documented, if I may say so myself.

Usage syntax

The basic syntax is:

hFig = uiinspect(handle)

Examples:

hFig = uiinspect(0);                         % the root handle
hFig = uiinspect(handle(0));
hFig = uiinspect(gcf);                       % current figure
hFig = uiinspect(handle(gcf));
uiinspect('java.lang.String');               % Java classname
uiinspect(java.lang.String('yes'));          % Java object
uiinspect(get(gcf,'JavaFrame'));             % Java object
uiinspect(classhandle(handle(gcf)));         % UDD class object
uiinspect(findprop(handle(gcf),'MenuBar'));  % UDD property
uiinspect(actxserver('Excel.Application'));  % COM object
uiinspect(Employee)                          % Matlab class object
uiinspect(?handle)                           % Matlab metaclass object
uiinspect('meta.class')                      % Matlab class name
uiinspect(System.DateTime.Now)               % Dot-Net object

uiinspect returns a handle to the created figure window. uiinspect opens a regular Matlab figure window which may be accessed via hFig (unlike Matlab’s methodsview and inspect functions which open Java frame that is not accessible from Matlab).

Unlike Matlab’s functions, multiple uiinspect windows can be opened simultaneously, for different objects. The differentiation is done based on figure title, which contains the inspected object’s name (if available) and its class – reinspecting the same object will reuse the existing figure window, but in all other cases a new figure window will be created.

Main panels

uiinspect includes the following information panels, that shall be described separately below:

  • Class information (including superclasses, if applicable)
  • Methods (for objects) or graphic handle hierarchy (for Handle Graphics)
  • Callbacks (where applicable)
  • Inspectable properties
  • Other properties plus full meta-data (where applicable)

The panels are fully resizable. We can drag the divider lines up/down or left/right and the contents automatically adjust accordingly. Each panel has a minimal viewable width/height, and the dividers cannot be dragged to squeeze the panels below these minimums – they can only be minimized, which hides the relevant panel entirely. To minimize a panel, simply click the relevant small arrow mark on the divider. The opposite arrow mark next to it maximizes the panel, effectively minimizing the panel on the other side. Once minimized/maximized, the divider can be restored by simply clicking it once, or by dragging it (again, panel minimum sizes apply).

uiinspect only uses Java panels, so implementing the dividers required use of the simple JSplitPane. In a general case where we might wish to embed Matlab graphs in one of the side panels, we would need to employ a more sophisticated solution (see my UISplitPane utility).

Class information

The top-left panel displays a label with information about the object’s class and super-classes inheritance (where applicable).

The class name itself is hyper-linked to the class’s documentation: if this is a standard Java class, then to the official online javadoc for this class which opens up in Matlab’s internal web browser. In fact, since different Matlab releases use different JVM versions (1.3 through 1.6), the link points to the documentation page corresponding to the JVM version actually used.

If the class is non-Java, the hyperlink displays the class’s help section in Matlab’s Command Window / console. The panel’s tooltip displays the same information in a slightly different manner.

The hyperlink in the label is actually an optical illusion. In fact, the entire label is hyper-linked, and clicking any part of it will display the relevant documentation (a similar optical illusion is used to display the hyperlink at the footer of the utility window). The illusion is achieved using Matlab’s HTML formatting, where the part of the label string consisting of the class name is underlined. The cursor was dynamically modified to a pointed hand-finger when the mouse hovers over the label, using the following simple Java-based command:

methodsLabel.setCursor(java.awt.Cursor(java.awt.Cursor.HAND_CURSOR));

Special treatment is done to extract the class’s superclass, the interfaces that it implements and any possible class qualifiers (for example, “final”).

For those interested to dig within the code, all this is done in uiinspect‘s getMethodsPane function.

Next to the class label, a checkbox is presented (“Extra”). Clicking this checkbox displays additional meta-data information (qualifiers, interrupts and inheritance) in the methods pane beneath. Not all classes have all these extra meta-data fields – only the relevant extra meta-information fields are displayed. If there are is extra meta-data, then the checkbox is not displayed. This is done in the getMethodsTable function.

Methods or HG hierarchy panel

The utility’s main panel displays either a table of methods (functions) for a class object, or a tree hierarchy for an HG handle.

Class object methods

The methods table takes the information from the getObjMethods function, which is an adaptation of Matlab’s built-in methodsview function. Part of the adaptation is to hyperlink all class references (used in the methods’ inputs, outputs and meta-data), such that clicking them will open new corresponding uiinspect windows.

Class object methods panel

Class object methods panel

The methods data is displayed within a non-editable Java table (in the getMethodsTable function) that auto-resizes the columns. The table columns are sortable, even sortable on multiple columns by CTRL-clicking (methodsview allows only simple sorting). This is done using JIDE’s TreeTable component. The table is placed within a scroll-pane having automatic scrollbars that only appear as needed.

The table’s MouseMovedCallback property is set to tbMouseMoved, which updates the mouse cursor (either regular or pointed finger) based on the current mouse position in the table (whether over a hyperlinked cell or not).

The table’s MousePressedCallback property is set to tbMousePressed, which opens new uiinspect figure windows for the hyperlinked classes (if any) in the clicked cell.

HG hierarchy tree

For HG handles, getHandleTree creates a Java tree that displays the hierarchy of HG children (as recursively reported by any HG handle’s Children property). For convenience, I have chosen to use the built-in component com.mathworks.hg.peer.UITreePeer that underlies the built-in uitree function. For performance reasons, the tree is not fully evaluated: the inspected handle’s Parent is set as the tree’s Root. The root node is expanded to get all the parent’s Children (i.e., the inspected handle’s siblings), and then the inspected handle’s tree node is again expanded to display its direct descendents.

Normal dynamic HG handle tooltip

Normal dynamic HG handle tooltip

A MouseMovedCallback is set on the tree to process mouse hover events in the treeMouseMovedCallback function. This function updates the tree tooltip dynamically, in the sense that it presents a different tooltip for different handles (tree nodes).

Invalid HG handles (this can happen if the HG handle was deleted since the time that uiinspect generated the tree) are displayed with a special warning message.

Invalid HG handle tooltip

Invalid HG handle tooltip

This dynamic tree behavior is achieved by storing the relevant handle information in the UserData of the different tree nodes. Unfortunately, starting in R2012a, Matlab has made a change in the internal support of Java objects, and the UserData property is no longer available. Such a case is detected and the data is stored in the tree nodes’ ApplicationData property instead (using setappdata(node,’userdata’,…) ).

Dynamic context (right-click) menu

Dynamic context (right-click) menu

A MousePressedCallback is set on the tree to process context (right-click) events in the treeMousePressedCallback function. The context-menu is also dynamic, in the sense that it presents a different context menu for different handles (tree nodes), again based on their user-data.

Left-clicking a node is not processed by treeMousePressedCallback, but rather by the tree’s NodeSelectedCallback which is processed in nodeSelected, and by NodeExpandedCallback which is processed by nodeExpanded. nodeSelected reloads uiinspect for the selected handle; nodeExpanded merely displays the expanded handle’s children.

Since the ‘+’ sign (which triggers nodeExpanded) and the handle icon (which triggers nodeSelected) are so close, we should be careful to click the ‘+’, otherwise the entire uiinspect window will reload the tree based on the clicked node… If anyone has a good idea how to solve this dilemma, then I’m all ears.

Like the methods table, the tree is also placed in a dynamic scroll-pane that displays scrollbars only as needed.

Callbacks panel

The callbacks panel, computed in getCbsData is based on a reflection of the object’s data as reported by the undocumented built-in classhandle function. I aggregate all the object’s events, as well as all the object property names that end with ‘Fcn’ or ‘Callback’. This takes care (I hope) of all the different manners by which different kinds of objects raise events that are trappable in Matlab callbacks. Specifically, it takes care of Java/Matlab classes as well as HG handles and COM objects. If anyone thinks that I have forgotten something, please let me know.

The getCbsPane function then displays the callbacks data (callbacks’ property name and value) in a Java table (JIDE PropertyTable, JIDE TreeTable, or failing those a simple JTable).

Modifiable object callbacks

Modifiable object callbacks

The callbacks are automatically grouped by name into logical groups (in getTreeData). For example, all callbacks whose names start with “Mouse*” are grouped in the “Mouse callbacks” group. The last group is always called “Other callbacks” and contains all callbacks for which a matching sibling callback has not been found. The groups are automatically collapsed by default; if only a single group is found then this group is automatically opened (for example, in the case of uiinspect(0) ).

The callbacks table’s toolbar enables displaying the callbacks by groups or sorted alphabetically. It also has “expand” and “collapse” icons that affect all the groups.

A checkbox next to the table’s toolbar enables hiding standard Java Swing callbacks. This is important when we inspect Java controls and only wish to see its unique callbacks. When using this checkbox, red Java exceptions are sometimes displayed in the Matlab console – these are harmless and you can safely ignore them (I hope to find a way to prevent them one day).

The table’s right column displays the callback properties values (if available). This column is editable and we can interactively modify any callback’s property. As shown, we can enter callback value in either of Matlab’s supported formats: string, function handle and (for non-COM objects only!) a cell array of function handle and additional data. An error message will be displayed if the callback value is invalid or cannot be set for some reason.

If it is determined that there are no callbacks, then the callbacks panel is automatically minimized, to enable maximum space for the methods panel above it.

Properties inspector panel

The properties inspection panel, prepared in getPropsPane, is actually composed of two separate panes: the top pane uses the built-in Matlab component com.mathworks.mlwidgets.inspector.PropertyView, which in turn uses JIDE’s PropertyTable. PropertyView is the same component used by Matlab’s standard inspect function (that’s how I came to know it, if anyone wonders).

uiinspect's property inspector table

uiinspect's property inspector table

The benefit of using Matlab’s PropertyView component rather than JIDE’s PropertyTable is that PropertyView has the very useful method setObject which I use to point the component at the inspected object, which automatically infers its non-hidden properties and updates the table, saving me a lot of work.

There are two drawbacks of using Matlab’s PropertyView:

  • PropertyView only displays non-hidden properties. One day when I have time, I intent to add the hidden properties to the resulting JIDE PropertyTable. But for now it only shows non-hidden properties.
  • PropertyView causes a Matlab crash on some Matlab releases, in case dbstop if error is active (this can be replicated using Matlab’s standard inspect). I therefore regrettably need to disable this specific dbstop.

I’ve been meaning to do these two fixes ever since I released uiinspect back in 2007, but for now that’s the way it is…

The properties data is retrieved via the getPropsData function. This function uses the built-in Matlab functions meta.class.fromName(className) and metaclass(classObject) to get the class handle of Matlab classes (in getMetaClass); similarly, loadClass loads the class definition for a Java class. I inspect these class handles for their contained properties. I then use the fieldnames function to add static class fields, which are not standard properties (for example, “RED” is a static field of the java.awt.Color class).

From the class handle, I retrieve the full definition of each property. This includes meta-data such as whether the property is regular or hidden (undocumented); settable or not; gettable or not; and any additional qualifiers (e.g., Sealed, Dependent, Constant, Abstract, Transient, Default (factory) value).

Object properties tooltip

Object properties tooltip

We now have a list of all properties and static fields, and this is used to display the entire properties data in the properties panel’s title (“Inspectable object properties”) tooltip. This tooltip, created in updateObjTooltip and getPropsHtml, uses some fancy HTML formatting to display all the object’s properties and values, color- and font-style-coded to show which of the properties is read-only, hidden, undefined etc.

The 'Other properties' meta-data table

The 'Other properties' meta-data table

The entire information is also displayed in the properties meta-data pane (“Other properties”) beneath JIDE’s inspector pane. Here we use a simple Java table to display the information in color-coding (gray for read-only properties; blue for static fields; red for irretrievable properties).

Separate checkboxes enable displaying all properties (by default only the properties that are NOT displayed in JIDE’s inspector table are displayed); and whether or not to display the extra meta-data in the properties table (by default only the property name and current value are displayed).

In some cases (e.g., Dot-Net objects), Matlab’s inspector does not know how to extract the property-bean information and so the PropertyView inspector is not shown, only the “other properties” table.

Both JIDE’s inspector table and the “other properties” table enable the user to modify existing values. Note that in some cases Matlab prevents interactive update of some properties, and in some other cases I have seen Matlab hang when trying to update a few specific properties. But in most cases updating the value does work as expected.

The combination of the inspector table, the meta-data table and the tooltip, enable users to fully understand the accessible properties of the inspected object. Of course, it would have been much better to merge the JIDE inspector table with the hidden properties (=additional rows) and meta-data (=additional columns). But let’s leave something for the future, shall we?

Auto-update mechanism

uiinspect auto-update notice

uiinspect auto-update notice

uiinspect employs the same auto-update background mechanism used by findjobj – after presenting the GUI, the utility silently checks the File Exchange webpage to see whether any newer version of this utility has been uploaded. If so, then a popup notice is presented with the date and description of the latest version. The popup enables users to download the newer version into their Matlab path, or skip. There is also an option to skip the update and not to remind ever again.

I find this background auto-update mechanism quite useful and generic. In fact, I uploaded it as a separate File Exchange utility today, following Brett Shoelson’s suggestion last month. You can find the underlying code in the checkVersion function.

TODO

  • cleanup internal functions, remove duplicates etc.
  • link property objects to another uiinspect window for these objects
  • display object children (& link to them) – COM/Java
  • find a way to merge the other-properties table with the inspector table (hidden props + meta-data)
  • find a way to use the inspector without disabling dbstop if error
  • Fix: some fields generate a Java Exception from: com.mathworks.mlwidgets.inspector.PropertyRootNode$PropertyListener$1$1.run
  • Fix: using the “Hide standard callbacks” checkbox sometimes issues Java Exceptions on the console
  • Fix: In HG tree view, sometimes the currently-inspected handle is not automatically selected

I would be happy if anyone can help with any of these.

Conclusion

I believe that this has been my longest blog post ever; certainly the one that I have labored most over. This correlates well with the uiinspect utility, which has been one of my most complex tasks. I’m guessing I must have invested 100-200 man-hours developing and improving it over the years.

I hope you find uiinspect as useful and as fun as I do. I believe that its source-code is certainly worth reading if you are interested in any advanced Matlab GUI programming, showing how Java GUI components can be combined in Matlab. Go ahead and download uiinspect from the Matlab file Exchange.

 
Related posts:
  1. Uitable sorting Matlab's uitables can be sortable using simple undocumented features...
  2. Minimize/maximize figure window Matlab figure windows can easily be maximized, minimized and restored using a bit of undocumented magic powder...
  3. Uitable customization report Matlab's uitable can be customized in many different ways. A detailed report explains how. ...
  4. JIDE Property Grids The JIDE components pre-bundled in Matlab enable creating user-customized property grid tables...
 

Getting default HG property values

$
0
0

All Matlab’s Handle Graphics (HG) property have default values. These values are used unless we specifically override the property value. For example, in R2012a, Matlab figure handles have 62 documented and 28 undocumented properties, all of which have some default value. When we create a new Matlab figure, we typically override only a handful of these properties.

How Matlab determines an HG property value

How Matlab determines an HG property value

For example, we might override the figure’s Name, NumberTitle, Position, Visible, Colormap and perhaps a few other properties. All the others are either read-only (i.e., un-settable), or left at their default values. This is also true for all HG objects: axes, images, plots, patches, uicontrols, annotations, Java control containers etc.

Matlab makes a distinction between factory and default values. Users can modify the default values, but not the factory values, which makes sense. In essence, user-specified property values override the default values, which in turn override the factory values. I find that this makes the process of using default values quite intuitive. I like this factory/default design.

Matlab has a dedicated doc page explaining how we can use, set and reset the default property values.

Unfortunately, MathWorks has not seen fit to explain how to get the full list of current default defaults, nor how to get the factory values. Today’s article provides the missing manual pages and completes the picture.

Accessing default and factory property values

To access any specific property’s default value, we need to compose a fictitious property name from the string ‘Default’ or ‘Factory’, followed by the object’s type (‘Figure’, ‘Axes’, ‘Line’ etc., as reported by the object’s Type property), and lastly the property name. For example: DefaultFigureColor or FactoryAxesUnits. As with all HG properties, these names are case insensitive. These fictitious properties all belong to Matlab’s root (0) handle.

We can now get and set the values of any of these fictitious properties (naturally, factory properties cannot be set):

>> get(0,'FactoryFigureUnits')
ans =
pixels
 
>> get(0,'FactoryFigureColor')
ans =
     0     0     0
 
>> get(0,'DefaultFigureColor')
ans =
                       0.8                       0.8                       0.8
 
>> set(0,'DefaultFigureColor','y');  % new figures will now have a yellow background color...
 
>> set(0,'DefaultFigureColor','factory');  % resets the default value to the factory value [0,0,0]=black

Note that since the default and factory property names are fictitious (i.e., dynamic properties that are parsed on-the-fly), they do not appear when you get(0), getundoc(0) or even uiinspect(0).

My uiinspect utility reports the factory values in its property-details panel, along with additional meta-data such as whether the properties are settable, readable etc.

uiinspect's 'Other properties' meta-data table

uiinspect's 'Other properties' meta-data table

Getting the full list of factory/default values

To get the long list of factory values, simply get a partial fictitious property name:

>> get(0,'factory')
ans = 
                         factoryFigureAlphamap: [1x64 double]
                       factoryFigureBusyAction: 'queue'
                    factoryFigureButtonDownFcn: ''
                         factoryFigureClipping: 'on'
                  factoryFigureCloseRequestFcn: 'closereq'
                            factoryFigureColor: [0 0 0]
                        (... 655 additional properties ...)
 
>> get(0,'default')
ans = 
               defaultTextColor: [0 0 0]
              defaultAxesXColor: [0 0 0]
              defaultAxesYColor: [0 0 0]
              defaultAxesZColor: [0 0 0]
          defaultPatchFaceColor: [0 0 0]
          defaultPatchEdgeColor: [0 0 0]
               defaultLineColor: [0 0 0]
    defaultFigureInvertHardcopy: 'on'
             defaultFigureColor: [0.8 0.8 0.8]
               defaultAxesColor: [1 1 1]
          defaultAxesColorOrder: [7x3 double]
          defaultFigureColormap: [64x3 double]
        defaultSurfaceEdgeColor: [0 0 0]
         defaultFigurePaperType: 'A4'
        defaultFigurePaperUnits: 'centimeters'
         defaultFigurePaperSize: [20.98404194812 29.67743169791]
          defaultFigurePosition: [200 200 560 420]
 
>> get(0,'DefaultAxes')
ans = 
        defaultAxesXColor: [0 0 0]
        defaultAxesYColor: [0 0 0]
        defaultAxesZColor: [0 0 0]
         defaultAxesColor: [1 1 1]
    defaultAxesColorOrder: [7x3 double]

We can see that the defaults list is much shorter than the factory list. There are very few actual default overrides of the factory values. In fact, if we try to get the default value of a property that was not overridden (e.g., DefaultFigureNumberTitle), Matlab is smart enough to return the factory value (in this case, FactoryFigureNumberTitle=’on’).

Hidden properties

Hidden (undocumented) properties are not shown by default, but you can always access them directly, and their list can also be seen if we set the root handle’s HideUndocumented property:

>> get(0,'FactoryAxesLooseInset')
ans =
         0.13         0.11         0.095         0.075
 
>> get(0,'DefaultPatchLineSmoothing')
ans =
off
 
>> set(0,'DefaultLineLineSmoothing','on');  % default appears to be 'off' for Windows, 'on' for Macs
 
>> set(0,'HideUndocumented','off')
>> allPropDefaults = get(0,'factory');
>> length(fieldnames(allPropDefaults))   % 661 documented + 277 undocumented properties
ans =
   938

Factory values internals

For those interested in some internals, the factory values are stored (and can be accessed) via the object’s UDD reference, or rather the schema.prop reference of the properties (additional information on UDD properties can be found here). For example:

>> get(0,'FactoryFigurePosition')
ans =
   100   100   660   520
 
>> hProp = findprop(handle(gcf),'pos')
hProp =
	schema.prop
 
>> get(hProp)
            Name: 'Position'
     Description: ''
        DataType: 'figurePositionType'
    FactoryValue: [100 100 660 520]
     AccessFlags: [1x1 struct]
         Visible: 'on'
     GetFunction: []
     SetFunction: []
 
>> hProp.FactoryValue
ans =
   100   100   660   520

Note that in this example, the FactoryFigurePosition value ([100 100 660 520]) is different than the DefaultFigurePosition value ([200 200 560 420]), which overrides it.

Conclusion

Setting default values enables easy setup of property values for all instances of an HG property in a Matlab session. It could be very tempting to add such setup to the startup.m file, so that such customizations automatically occur for all Matlab sessions. However, I strongly suggest against this: the moment you will try to run your application on any other computer or Matlab installation, you may find that your GUI/graphics look entirely different.

A much safer approach is to understand how these default values affect your application and then specifically set the desired property values in your m-code. This way, whatever the installation’s default values are, your application will always retain a consistent look-and-feel.

Have you found or ever used any interesting default or factory property value? If so, please share your experience in a comment.

 
Related posts:
  1. Modifying default toolbar/menubar actions The default Matlab figure toolbar and menu actions can easily be modified using simple pure-Matlab code. This article explains how....
  2. Axes LooseInset property Matlab plot axes have an undocumented LooseInset property that sets empty margins around the axes, and can be set to provide a tighter fit of the axes to their surroundings....
  3. Plot LineSmoothing property LineSmoothing is a hidden and undocumented plot line property that creates anti-aliased (smooth unpixelized) lines in Matlab plots...
  4. Property value change listeners HG handle property changes can be trapped in a user-defined callback. ...
 

Handle Graphics Behavior

$
0
0

Matlab’s Handle Graphics (HG) have been around for ages. Still, to this day it contains many hidden gems. Today I discuss HG’s Behavior property, which is a standard undocumented hidden property of all HG objects.

Behavior is not normally updated directly (although there is absolutely nothing to prevent this), but rather via the semi-documented built-in accessor functions hggetbehavior and hgaddbehavior. This manner of accessing Behavior is similar to its undocumented sibling property ApplicationData, which is accessed by the corresponding getappdata and setappdata functions.

Using HB behaviors

hggetbehavior with no input args displays a list of all pre-installed HG behaviors:

>> hggetbehavior
 
   Behavior Object Name         Target Handle
   --------------------------------------------
   'Plotedit'...................Any Graphics Object   
   'Print'......................Any Graphics Object   
   'Zoom'.......................Axes                  
   'Pan'........................Axes                  
   'Rotate3d'...................Axes                  
   'DataCursor'.................Axes and Axes Children
   'MCodeGeneration'............Axes and Axes Children
   'DataDescriptor'.............Axes and Axes Children
   'PlotTools'..................Any graphics object   
   'Linked'.....................Any graphics object   
   'Brush'......................Any graphics object

hggetbehavior can be passed a specific behavior name (or cell array of names), in which case it returns the relevant behavior object handle(s):

>> hBehavior = hggetbehavior(gca, 'Zoom')
hBehavior =
	graphics.zoombehavior
 
>> hBehavior = hggetbehavior(gca, {'Zoom', 'Pan'})
hBehavior =
	handle: 1-by-2

As the name indicates, the behavior object handle controls the behavior of the relevant action. For example, the behavior object for Zoom contains the following properties:

>> hBehavior = hggetbehavior(gca, 'Zoom');
>> get(hBehavior)
       Enable: 1        % settable: true/false
    Serialize: 1        % settable: true/false
         Name: 'Zoom'   % read-only
        Style: 'both'   % settable: 'horizontal', 'vertical' or 'both'

By setting the behavior’s properties, we can control whether the axes will have horizontal, vertical, 2D or no zooming enabled, regardless of whether or not the toolbar/menu-bar zoom item is selected:

hBehavior.Enable = false;         % or: set(hBehavior,'Enable',false)
hBehavior.Style  = 'horizontal';  % or: set(hBehavior,'Style','horizontal')

This mechanism is used internally by Matlab to disable zoom/pan/rotate3d (see %matlabroot%/toolbox/matlab/graphics/@graphics/@zoom/setAllowAxesZoom.m and similarly setAllowAxesPan, setAllowAxesRotate).

At this point, some readers may jump saying that we can already do this via the zoom object handle that is returned by the zoom function (where the Style property was renamed Motion, but never mind). However, I am just trying to show the general usage. Not all behaviors have similar documented customizable mechanisms. In fact, using behaviors we can control specific behaviors for separate HG handles in the same figure/axes.

For example, we can set a different callback function to different HG handles for displaying a plot data-tip (a.k.a. data cursor). I have explained in the past how to programmatically control data-tips, but doing so relies on the figure datacursormode, which is figure-wide. If we want to display different data-tips for different plot handles, we would need to add logic into our custom update function that would change the returned string based on the clicked handle. Using HG behavior we can achieve the same goal much easier:

% Use dataCursorLineFcn() for the line data-tip
bh = hggetbehavior(hLine,'DataCursor');
set(bh,'UpdateFcn',@dataCursorLineFcn);
 
% Use dataCursorAnnotationFcn() for the annotation data-tip
bh = hggetbehavior(hAnnotation,'DataCursor');
set(bh,'UpdateFcn',{@dataCursorAnnotationFcn,extraData});

Note: there is also the related semi-documented function hgbehaviorfactory, which is used internally by hggetbehavior and hgaddbehavior. I do not see any need for using hgbehaviorfactory directly, only hggetbehavior and hgaddbehavior.

Custom behaviors

The standard behavior objects are UDD schema objects (i.e., the old object-oriented mechanism in MATLAB). They are generally located in a separate folder beneath %matlabroot%/toolbox/matlab/graphics/@graphics/. For example, the Zoom behavior object is located in %matlabroot%/toolbox/matlab/graphics/@graphics/@zoombehavior/. These behavior object folders generally contain a schema.m file (that defines the behavior object class and its properties), and a dosupport.m function that returns a logical flag indicating whether or not the behavior is supported for the specified handle. These are pretty standard functions, here is an example:

% Zoom behavior's schema.m:
function schema
% Copyright 2003-2006 The MathWorks, Inc.
 
pk = findpackage('graphics');
cls = schema.class(pk,'zoombehavior');
 
p = schema.prop(cls,'Enable','bool');
p.FactoryValue = true;
 
p = schema.prop(cls,'Serialize','MATLAB array');
p.FactoryValue = true;
p.AccessFlags.Serialize = 'off';
 
p = schema.prop(cls,'Name','string');
p.AccessFlags.PublicSet = 'off';
p.AccessFlags.PublicGet = 'on';
p.FactoryValue = 'Zoom';
p.AccessFlags.Serialize = 'off';
 
% Enumeration Style Type
if (isempty(findtype('StyleChoice')))
    schema.EnumType('StyleChoice',{'horizontal','vertical','both'});
end
p = schema.prop(cls,'Style','StyleChoice');
p.FactoryValue = 'both';
% Zoom behavior's dosupport.m:
function [ret] = dosupport(~,hTarget)
% Copyright 2003-2009 The MathWorks, Inc.
 
% axes 
ret = ishghandle(hTarget,'axes');

All behaviors must define the Name property, and most behaviors also define the Serialize and Enable properties. In addition, different behaviors define other properties. For example, the DataCursor behavior defines the CreateNewDatatip flag and no less than 7 callbacks:

function schema
% Copyright 2003-2008 The MathWorks, Inc.
 
pk = findpackage('graphics');
cls = schema.class(pk,'datacursorbehavior');
 
p = schema.prop(cls,'Name','string');
p.AccessFlags.PublicSet = 'off';
p.AccessFlags.PublicGet = 'on';
p.FactoryValue = 'DataCursor';
 
schema.prop(cls,'StartDragFcn','MATLAB callback');
schema.prop(cls,'EndDragFcn','MATLAB callback');
schema.prop(cls,'UpdateFcn','MATLAB callback');
schema.prop(cls,'CreateFcn','MATLAB callback');
schema.prop(cls,'StartCreateFcn','MATLAB callback');
schema.prop(cls,'UpdateDataCursorFcn','MATLAB callback');
schema.prop(cls,'MoveDataCursorFcn','MATLAB callback');
 
p = schema.prop(cls,'CreateNewDatatip','bool');
p.FactoryValue = false;
p.Description = 'True will create a new datatip for every mouse click';
p = schema.prop(cls,'Enable','bool');
p.FactoryValue = true;
 
p = schema.prop(cls,'Serialize','MATLAB array');
p.FactoryValue = true;
p.AccessFlags.Serialize = 'off';

Why am I telling you all this? Because in addition to the standard behavior objects we can also specify custom behaviors to HG handles. All we need to do is mimic one of the standard behavior object classes in a user-defined class, and then use hgaddbehavior to add the behavior to an HG handle. Behaviors are differentiated by their Name property, so we can either use a new name for the new behavior, or override a standard behavior by reusing its name.

hgaddbehavior(hLine,myNewBehaviorObject)

If you wish the behavior to be serialized (saved) to disk when saving the figure, you should add the Serialize property to the class and set it to true, then use hgaddbehavior to add the behavior to the relevant HG handle. The Serialize property is searched-for by the hgsaveStructDbl function when saving figures (I described hgsaveStructDbl here). All the standard behaviors except DataDescriptor have the Serialize property (I don’t know why DataDescriptor doesn’t).

Just for the record, you can also use MCOS (not just UDD) class objects for the custom behavior, as mentioned by the internal comment within the hgbehaviorfactory function. Most standard behaviors use UDD schema classes; an example of an MCOS behavior is PlotEdit that is found at %matlabroot%/toolbox/matlab/graphics/+graphics/+internal/@PlotEditBehavor/PlotEditBehavor.m.

ishghandle‘s undocumented type input arg

Note that the Zoom behavior’s dosupport function uses an undocumented format of the built-in ishghandle function, namely accepting a second parameter that specifies a specific handle type, which presumably needs to correspond to the handle’s Type property:

ret = ishghandle(hTarget,'axes');

The hasbehavior function

Another semi-documented built-in function called hasbehavior is located right next to hggetbehavior and hgaddbehavior in the %matlabroot%/toolbox/matlab/graphics/ folder.

Despite its name, and the internal comments that specifically mention HG behaviors, this function is entirely independent of the HG behavior mechanism described above, and in fact makes use of the ApplicationData property rather than Behavior. I have no idea why this is so. It may be a design oversight or some half-baked attempt by a Mathworker apprentice to emulate the behavior mechanism. Even the function name is misleading: in fact, hasbehavior not only checks whether a handle has some “behavior” (in the 2-input args format) but also sets this flag (in the 3-input args format).

hasbehavior is used internally by the legend mechanism, to determine whether or not an HG object (line, scatter group, patch, annotation etc.) should be added to the legend. This can be very important for plot performance, since the legend would not need to be updated whenever these objects are modified in some manner:

hLines = plot(rand(3,3));
hasbehavior(hLines(1), 'legend', false);   % line will not be in legend
hasbehavior(hLines(2), 'legend', true);    % line will be in legend

(for anyone interested, the relevant code that checks this flag is located in %matlabroot%/toolbox/matlab/scribe/private/islegendable.m)

hasbehavior works by using a dedicated field in the handle’s ApplicationData struct with a logical flag value (true/false). The relevant field is called [name,'_hgbehavior'], where name is the name of the so-called “behavior”. In the example above, it creates a field called “legend_hgbehavior”.

Do you know of any neat uses for HG behaviors? If so, please post a comment below.

 
Related posts:
  1. Undocumented scatter plot behavior The scatter plot function has an undocumented behavior when plotting more than 100 points: it returns a single unified patch object handle, rather than a patch handle for each specific...
  2. Performance: accessing handle properties Handle object property access (get/set) performance can be significantly improved using dot-notation. ...
  3. Displaying hidden handle properties I present two ways of checking undocumented hidden properties in Matlab Handle Graphics (HG) handles...
  4. Waterloo graphics beta The Waterloo graphics library extends Matlab graphics with numerous customizable plots that can be embedded in Matlab figures. ...
 

HG2 update

$
0
0

Exactly three years ago, I posted information (here and here) about Matlab’s upcoming new graphics engine, so-called HG2 (Handle Graphics version 2). At the time, I was sure that HG2 was just around the corner. But three years and six releases have passed, Matlab 7 turned into Matlab 8, and HG1 is still in use. I decided that it was time to revisit the latest state of HG2, as reflected in the latest release, R2013a (Matlab 8.1).

In the past few years, development of HG2 has apparently progressed to a stage where most of the kinks were ironed out. The latest HG2 appears to be quite stable, and in my experience most GUI/graphics utilities run as-is, without any need for tweaking. This is good news, which leads me to think that HG2 will be released soon. It is possible that this could happen as early as the upcoming release (R2013b, 8.2) but I have a gut feeling that it will be in R2014a. I also have a gut feeling that MathWorks will name that release 9.0 rather than 8.3, in keeping with its arch-rival Mathematica.

HG2 has improved grid lines, plot anti-aliasing and customizable everything (more on this below). Here’s a simple plot line as it appears in both HG1 and HG2:

hFig = figure('pos',[100,100,300,250]);
x = -10:0.1:10;
y = 1e7*sin(x)./x; 
hLine = plot(x,y);
box off; grid on;
title('HG2 plot');

HG1 plotHG2 plot

Same plot in HG1 and HG2

We can see that MathWorks has invested heavily in improving usability. The graphics are now much more visually appealing than before. A lot of thought has gone into small details such as the plot colors and the axes gray shades. The changes are small when taken separately, but the overall gestalt is striking. HG2 will definitely justify my license maintenance cost.

Highly customizable

Matlab in HG2 mode acts and behaves pretty much as you would expect. There are no visible changes to the Desktop or the graphics interface. The major difference is that all graphics handles, whether interactive controls (figure, uicontrols, uitables, etc.) or graph elements (axes, lines, patches, etc.) are instances of class objects (e.g., matlab.ui.Figure or matlab.graphics.chart.primitive.Line) rather than numeric values. This makes it easy to issue commands such as:

hFig.Color = 'w';
 
hAxes = gca;
hAxes.Title.Color = 'm';  % default: [0,0,0] = black
hAxes.YRuler.SecondaryLabel.String = 'millions';  % original: 'x10^{6}'
hAxes.YRuler.SecondaryLabel.FontAngle = 'italic';  % default: 'normal'
hAxes.YRuler.Axle.LineStyle = 'dotted';  % default: 'solid'
hAxes.YRuler.Axle.ColorData = uint8([0,100,0,255])';  %=dark green; default: [51 51 51 255], corresponding to [0.2 0.2 0.2 1]
hAxes.YBaseline.Color = 'b';  % default: [0.2 0.2 0.2]
hAxes.YBaseline.Visible = 'on';  % default: 'off'
hAxes.XRuler.Axle.Visible = 'off';  % default: 'on'
 
hLine.Color = [1,0,0];  %='red'

rather than using the corresponding set(…) or get(…) functions, which are still supported for backward compatibility.

Customized HG2 plot

Customized HG2 plot

Notice how much more customizable HG2 is compared to HG1. I am pretty excited from the huge number of additional possible customizations in HG2 compared to HG1. It is real a pity that many of these customizations rely on hidden/undocumented properties (see below). Hopefully this will change when HG2 is officially released.

Some observations

Here are a few observations that I collected on the latest HG2, as reflected in R2013a:

  1. Java is still supported (hurray!). The warnings about the figure’s JavaFrame property becoming deprecated have fortunately not been fulfilled (hopefully never). All the Java-based GUI tricks shown on this blog and in my book still work, excluding some minor things here and there which are due to inter-release changes rather than to the new HG2 engine.
  2. In order to access the top-level Java Frame of a figure window, we now need to use javaFrame.fHG2Client rather than javaFrame.fHG1Client. The relevant code should now look something like this, in order to be fully-compatible with older Matlab releases:
    jFrame = get(handle(hFig), 'JavaFrame');
    try
        % This works up to R2011a
        jFrame.fFigureClient.setClientDockable(true);
    catch
        try
            % This works from R2008b and up, up to HG2
            jFrame.fHG1Client.setClientDockable(true);
        catch
            % This works in HG2
            jFrame.fHG2Client.setClientDockable(true);
        end
    end
  3. Anti-aliasing of plot elements (a.k.a. line -smoothing) is now ‘on’ by default (double hurray!). Apparently, MathWorks solved the problems with the existing undocumented LineSmoothing property. Still, for some unknown reason, LineSmoothing remains a hidden/undocumented property. Note that for some objects the property name is different. For example, the axes title (which is a text object of class matlab.graphics.primitive.Text) has a new property called Smoothing that controls anti-aliasing (unlike LineSmoothing, Smoothing appears to be an un-hidden fully-documented property).
    R2013b addendum: The figure handle now includes a property called GraphicsSmoothing that controls anti-aliasing at the entire figure level (default=’on’). No more need to set individual graphic elements, although we still can if we want (alas, this flexibility may be removed soon – see item #6 below). I would have liked to see the anti-aliasing feature use the same property name for all graphic elements, rather than GraphicsSmoothing/LineSmoothing/Smoothing, but maybe I’m just being an ungrateful spoil-sport… The good news about GraphicsSmoothing is that this is a non-hidden property. This means it can be seen with get(gcf) and once HG2 becomes live it will become fully documented/supported – hurray!
  4. Many new properties have been added to graphic objects, that enable customization of different aspects. For example, we can customize the axes grid-lines, containing box and exponent labels in ways that were impossible in HG1 (triple hurray!). Note that many of these new properties are hidden/undocumented (why the hell for???), so we need a utility such as my uiinspect or getundoc to detect them. Some of the useful new axes properties include *Ruler, *Baseline, *GridHandle, BoxFrame and BackDrop (I showed an example usage of *Ruler and *Baseline above). I have absolutely no idea why these so-useful properties are kept hidden, it simply makes no sense.
  5. Some existing HG1 properties are missing. For example, the UserData property is no longer available for some Java objects (this is a real pity — I depended on it for many functionalities, such as storing node-specific data in uitree/JTree nodes). Similarly, axes no longer have *LimInclude properties (this actually makes sense – these properties are still available in plot lines, where they actually have a use).
  6. Some existing HG1 properties now issue a warning, although they still work. For example:
    >> hAxes.DrawMode = 'fast';
    Warning: The DrawMode property will be removed in a future release.
    (Type "warning off MATLAB:hg:willberemoved" to suppress this warning.) 
     
    >> hLine.LineSmoothing
    Warning: The LineSmoothing property will be removed in a future release.
    (Type "warning off MATLAB:hg:willberemoved" to suppress this warning.) 
    ans =
    on

    R2013b addendum: hAxes.DrawMode no longer issues a warning, although hLine.LineSmoothing does.

  7. There is an open bug on R2012b and R2013a whereby the clf function does not delete javacomponent objects. This bug does not affect HG2, where clf works properly.
  8. Some GUI components are being placed a pixel or two sideways in HG2 compared to HG1. This has no visual importance except in very rare cases, but it does affect my findjobj utility, which relies on the component’s position to find its underlying Java object. I have updated findjobj for the upcoming HG2 and it should work with both HG1 and HG2.
  9. The default axes and labels color has changed from black to gray ([0.2 0.2 0.2]). Grid lines now use an even lighter gray shade. Visually I think that this is a great change, since it directs the viewer’s focus on the plot contents rather than the external decorations.
  10. The default axes plot color order has changed. The standard plot color is no longer blue (as it was for ages in Matlab), but a bluish tint; the second color is no longer red but light green; the third color is reddish rather than dark green, etc.:
    % HG1
    >> get(0,'defaultAxesColorOrder')
    ans =
                0            0            1
                0          0.5            0
                1            0            0
                0         0.75         0.75
             0.75            0         0.75
             0.75         0.75            0
             0.25         0.25         0.25
     
    %HG2
    >> get(0,'defaultAxesColorOrder')
    ans =
         0.070588      0.40784      0.70196
          0.92941      0.14118      0.14902
          0.60784       0.7451      0.23922
          0.48235      0.17647       0.4549
                1      0.78039            0
          0.30196       0.7451      0.93333
          0.82353       0.4549            0

    R2013b addendum: The default colors have changed a bit (for the better I think). I still think that the relative order should more closely match the current order (blue-green-red-etc.), for compatibility with existing apps. A small utility function could be added that modifies the color-order to something that may be better suited for color-differentiation (see Tim Holy’s excellent utility for an example).

  11. HG2 axes no longer forget the previous plot color (unless we used hold all) — in HG2 color cycling is on by default. Note that this causes some visual discrepancies between HG1 and HG2 in plots that use hold on and have multiple plot lines: In HG1 they were all blue; in HG2 the first is bluish, the second is greenish, then reddish etc.
  12. GUIDE is still the same-ol’ GUIDE (sigh!). The figure toolbar and menubar have likewise not been upgraded, as far as I could tell.
  13. HG2 performance appears to be generally slower than HG1. Hopefully this will improve by the time HG2 is released, since performance has been one of HG1′s drawbacks all along. In my tests, most GUI/graphic aspects ran only slightly slower in HG2, except for 2D plots that were significantly slower. This is corroborated by running bench: on my computer, HG1 yields 0.4 for 2D and 0.22 for 3D; in HG2 the performance is 2.1 for 2D and 0.18 for 3D. Looks like the 2D performance still needs some work…

Testing HG2

As noted in my original article, we can start Matlab in HG2 mode by simply adding the startup (command-line) switch -hgVersion 2 to the Matlab command (note the space between the -hgVersion and the “2″). For example, in Windows, all you need to do is to copy your Matlab shortcut sideways (so that you will always have the standard HG1 version available), then right-click the shortcut, select “Properties”, then add -hgVersion 2 to the Target field (note the space between “hgVersion” and “2″). You will probably want to also add the “HG2″ descriptor to the shortcut name, in the “General” tab:

Matlab startup switch for HG2

Matlab startup switch for HG2

If you have any Matlab application that relies on GUI or graphics, I urge you to test it on the new HG2 system. It’s trivially simple and your application should work exactly the same, or better. If you do detect some incompatibility, please post a comment or shoot me an email. In due course I expect that MathWorks will open an official channel for this, but in the meantime I’ll be sure to pass the information to the relevant person.

Do take a moment for testing HG2 – we can all contribute to ensure that when HG2 does come out it will be perfect. It’s in our interest.

NYC visit

If you happen to be in New York next week, I urge you to attend the MATLAB Computational Conference on Thursday May 23 (free registration; my presentation is scheduled for 4:50pm). I would be happy to meet you to discuss how I could bring value to your needs, either financial-oriented or not. We could meet at the conference, or anywhere in New York on Wednesday May 22 or Friday May 24.

Matlab Computational Finance Conference - 23 May 2013

 
Related posts:
  1. Plot LimInclude properties The plot objects' XLimInclude, YLimInclude, ZLimInclude, ALimInclude and CLimInclude properties are an important feature, that has both functional and performance implications....
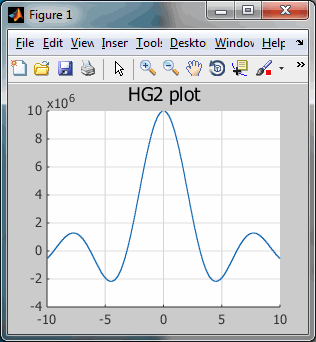
  2. FIG files format FIG files are actually MAT files in disguise. This article explains how this can be useful in Matlab applications....
  3. Panel-level uicontrols Matlab's uipanel contains a hidden handle to the title label, which can be modified into a checkbox or radio-button control...
  4. Performance: accessing handle properties Handle object property access (get/set) performance can be significantly improved using dot-notation. ...
 

Draggable plot data-tips

$
0
0

A couple of years ago, I was asked by a client to figure out a way to make Matlab plot data-tips movable. The problem was that he had a very crowded plot and Matlab’s standard data-tips are displayed immediately adjacent to the data, thereby overlapping the plot parts. Matlab’s standard data-tips enable dragging to a very limited extent (only to the 4 corners of the data-point), and in any case the displayed textbox remains directly attached to the data point.

So I developed a small utility for my client that solves this problem. I then forgot all about it until a few days ago when I came across it again. Yesterday I uploaded this draggableDataTips utility to the File Exchange, where you can download it.

draggableDataTips enables the user to interactively drag any newly-created data-tip, anywhere in the Matlab figure. A dashed line connects the dragged data-tip with the original data point. Simple, intuitive, and effective. At 300 lines, the draggableDataTips.m source code is compact and easy to follow, and you’re welcome to take a look and further customize this utility for your specific needs.

draggableDataTips utility in action

draggableDataTips utility in action


Technical implementation

The implementation of draggableDataTips relies on undocumented aspects of the data-cursor object exposed via the datacursormode function. I have already shown how these can be used to customize and control data-tips programmatically (rather than interactively). For draggableDataTips, we first get the cursor object’s meta-data classhandle (a schema.class object), then use it to find the meta-data for its hidden CurrentDataCursor property (a schema.prop object). There is also a more direct approach, using the findprop function.

Whichever alternative we choose, we finally use this object to set the property’s SetFunction meta-property. Quite straight-forward, I should say:

% Get the cursor-mode object
cursorObj = datacursormode(hFig);
 
% Alternative #1: the indirect route to the meta-property
ch = classhandle(cursorObj);
hPropIdx = strcmpi(get(ch.Properties,'Name'), 'CurrentDataCursor');
hProp = ch.Properties(hPropIdx);
 
% Alternative #2: the direct approach
hProp = findprop(cursorObj, 'CurrentDataCursor');
 
% Update the meta-property to use a custom function whenever new data-tips are created
hProp.SetFunction = @installNewMoveFcn;

This has the effect that all new data-tips that will be created from then on will call our custom installNewMoveFcn function when the data-tip object is created. This installNewMoveFcn function, in turn, simply replaces the data-tips standard default callback for mouse movement (which is used while dragging), to a new custom function textBoxUpdateFcn:

% Install a replacement callback function for datatip textbox mouse movement
function hDataTip = installNewMoveFcn(cursorObj, hDataTip)
    srcObjs = get(hDataTip.SelfListenerHandles,'SourceObject');
    for srcIdx = 1 : length(srcObjs)
        if strcmpi(srcObjs{srcIdx}.Name,'Orientation')
            hDataTip.SelfListenerHandles(srcIdx).Callback = @textBoxUpdateFcn;
            hDataTip.MarkerHandle.Marker = 'none';
            break;
        end
    end
end

The textBoxUpdateFcn function basically moves the datatip textbox to the new mouse location, without limiting its positions as Matlab’s standard default callback function did. A dashed connector line is then drawn to connect the center of the textbox with the data-point. It’s a bit long to include here, but interested readers are welcome to look at the code (lines #99 onward in draggableDataTips.m).

As can be seen from the screenshot above, standard and draggable data-tips can be used in the same plot. This is done by simply turning the draggability functionality on and off by draggableDataTips before creating a new data-tip (using either alt-click or programmatically):

draggableDataTips on    % or: draggableDataTips('on')  or: draggableDataTips(true)
draggableDataTips off   % or: draggableDataTips('off') or: draggableDataTips(false)

Notes:

  1. The actual code of draggableDataTips naturally contains more sanity checks, exception handling etc. I have only presented the core code in the snippets above, but you should always include such extra checks in any real-life program.
  2. There is a minor bug that causes the connector line to be on top of the box rather than beneath it, but aside from this all works ok. For some reason, uistack did not work. If anyone has a fix for this bug, please let me know.
  3. Did you notice that Java was not mentioned anywhere above? Mode managers, such as the data-cursor mode, use pure-Matlab functionality.

HG2

Unfortunately, when I tested draggableDataTips on HG2, Matlab’s upcoming new graphics engine, the utility failed. Data-cursors have undergone a significant reengineering in HG2 (about time!), causing multiple properties and methods to change names and functionality. But this could be overcome (see lines #43-53 in draggableDataTips.m).

However, I could not overcome the apparent fact that unlike HG1 (or more specifically, schema objects, that HG1 uses for its data-tips functionality), in HG2 (or rather, MCOS class objects) we cannot override an object’s meta-properties, specifically its SetMethod (which is the MCOS equivalent of schema.prop‘s SetFunction meta-property).

So for the moment, draggableDataTips does not work on HG2. I hope to find a solution for this by the time HG2 launches. If anyone finds a fix for the problem, please let me know. If I ever find or receive a fix, I will update this post with the relevant technical details.

For the moment there is no rush, since HG2 is still relatively far away in the distant future, and draggableDataTips works splendidly in the current HG1.

Have you used plot data-tips in some nifty way? If so, please share your experience in a comment below.

 
Related posts:
  1. Controlling plot data-tips Data-tips are an extremely useful plotting tool that can easily be controlled programmatically....
  2. Accessing plot brushed data Plot data brushing can be accessed programmatically using very simple pure-Matlab code...
  3. Plot LimInclude properties The plot objects' XLimInclude, YLimInclude, ZLimInclude, ALimInclude and CLimInclude properties are an important feature, that has both functional and performance implications....
  4. Undocumented scatter plot jitter Matlab's scatter plot can automatically jitter data to enable better visualization of distribution density. ...
 
Viewing all 30 articles
Browse latest View live