I would like to welcome guest blogger Adrian Cherry. Adrian will describe a very handy utility that shows how basic built-in Matlab functions can be improved and customized by just a bit of fiddling under Matlab’s hood.
Legend Plotting
Whilst I enjoy using the many time saving features of Matlab, one area where I feel it suffers is the technical plotting and annotation. This tale relates the development of a legend plotting routine, gridLegend, in an effort to improve the presentation.
In my day job we have a requirement to condense a large quantity of data onto summary charts. However, there is only so much data consolidation possible before you start losing the information required. We often need to plot 40 or 50 lines of test data to visualize trends or outliers, using the legend to identify the number of test hours against each test specimen.
Using the standard Matlab legend function resulted in a long legend over twice the size of the associated plot:
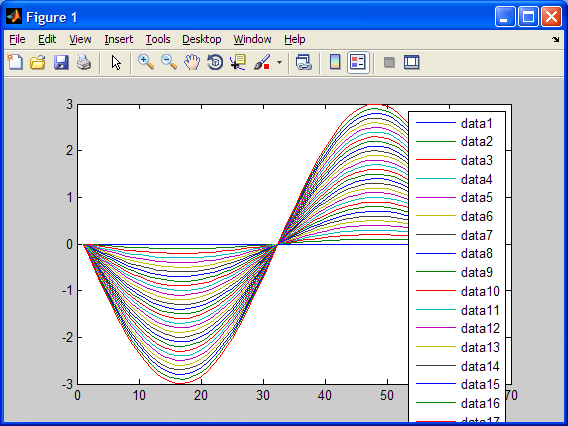
Standard Matlab legend
I wanted some way of generating a more compact legend format.
Fortunately earlier in the year, an entry on Matlab Central allowing a multi-column legend to be generated was posted, columnlegend. Although lacking some features, columnlegend gave me a good start on developing what I wanted for a multi column legend, culminating in gridLegend:
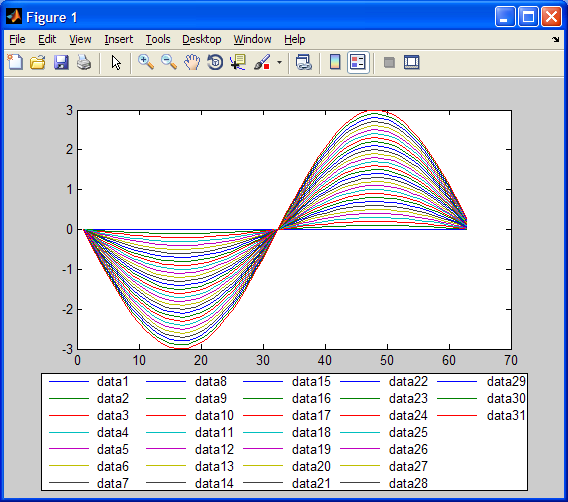
Multi-column legend
Delving into the Undocumented Matlab
So where is the link with undocumented Matlab?
As mentioned in the original columnlegend entry, it was relatively simple to redraw the legend as required on the screen. However, as soon as the figure was printed or exported to an image file, internal Matlab workings would redraw the figure, including the legend, thereby undoing my careful legend crafting, squeezing it back into one column (Yuck!):
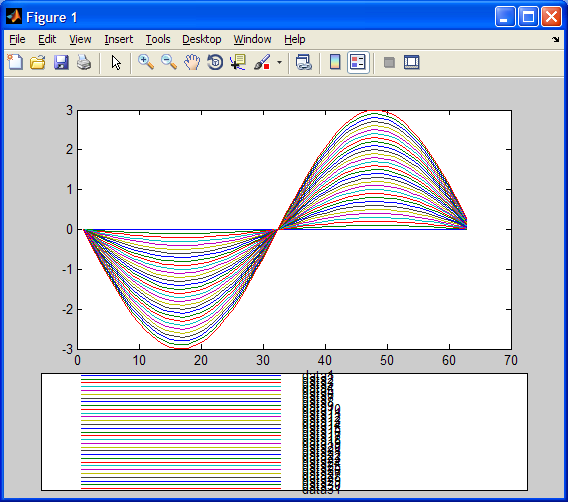
Matlab-reverted multi-column legend
As we wanted to automatically output images files, I had to delve into the hidden areas of Matlab to try to solve this problem.
My initial thought was to find out where the figure got redrawn for printing or export and override the standard legend call with a call to my new function. I couldn’t find the obvious culprit, stepping as far as I could through the print function there didn’t appear to be any call to the legend function.
In my search for information on how the legend worked I found the undocumented Matlab article about generating dynamic legends. This dynamic-legend post covered details about attaching a listener to a child of the legend axes, in Matlab the legend function creates its own set of axes on the figure to display the legend.
Armed with the information that legend axes objects could have listeners attached, I considered that these might be the source of redrawing the legend for printing. So with the legend I had generated I took a look at what listeners were attached, using the undocumented hidden axes property ScribeLegendListeners:
>> legendListener = get(gca,'ScribeLegendListeners')
legendListener =
        fontname: [1x1 handle.listener]
        fontsize: [1x1 handle.listener]
      fontweight: [1x1 handle.listener]
       fontangle: [1x1 handle.listener]
       linewidth: [1x1 handle.listener]
         deleted: [1x1 handle.listener]
    proxydeleted: [1x1 handle.listener]
The font size and line positioning were all being redrawn for printing so this was potentially the source of my problem. However I’d not looked at a handle.listener before, so a little further digging was required:
K>> get(legendListener.fontname)
      SourceObject: [1x1 schema.prop]
         Container: [1x1 axes]
         EventType: 'PropertyPostSet'
          Callback: {2x1 cell}
    CallbackTarget: []
           Enabled: 'on'
The option Enabled immediately drew my attention, and so the following lines were added to my gridLegend function to switch off these listeners and apply it back to the legend:
LL = get(gca,'ScribeLegendListeners');
set(LL.fontname,'enabled','off');
set(LL.fontsize,'enabled','off');
set(LL.fontweight,'enabled','off');
set(LL.fontangle,'enabled','off');
set(LL.linewidth,'enabled','off');
set(gca,'ScribeLegendListeners',LL);
Finally allowing me to output the image files with a multi-column legend:
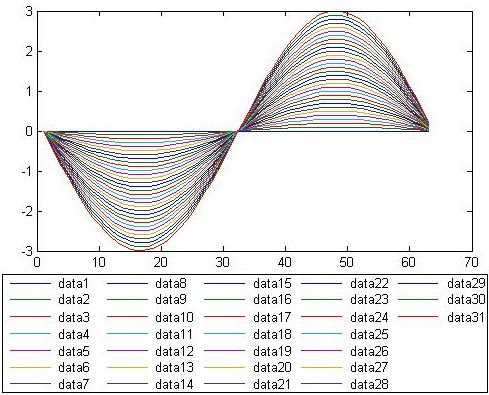
Printed multi-column legend
So my thanks to the contributors on Matlab Central who enabled me to get started on gridLegend and to Yair for collating the many nuggets of information on Undocumented Matlab which allowed me to complete the function and get it posted on Matlab Central.
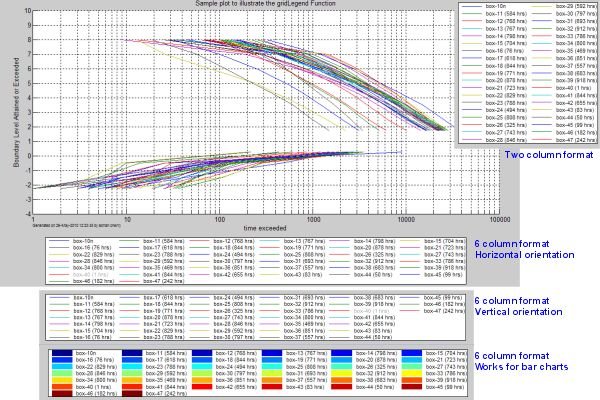
Multi-column legend in action
Related posts:
- Multi-line uitable column headers Matlab uitables can present long column headers in multiple lines, for improved readability. ...
- Legend ‘-DynamicLegend’ semi-documented feature The built-in Matlab legend function has a very useful semi-documented feature for automatic dynamic update, which is explained here....
- Inactive Control Tooltips & Event Chaining Inactive Matlab uicontrols cannot normally display their tooltips. This article shows how to do this with a combination of undocumented Matlab and Java hacks....
- Handle Graphics Behavior HG behaviors are an important aspect of Matlab graphics that enable custom control of handle functionality. ...