Exactly three years ago, I posted information (here and here) about Matlab’s upcoming new graphics engine, so-called HG2 (Handle Graphics version 2). At the time, I was sure that HG2 was just around the corner. But three years and six releases have passed, Matlab 7 turned into Matlab 8, and HG1 is still in use. I decided that it was time to revisit the latest state of HG2, as reflected in the latest release, R2013a (Matlab 8.1).
In the past few years, development of HG2 has apparently progressed to a stage where most of the kinks were ironed out. The latest HG2 appears to be quite stable, and in my experience most GUI/graphics utilities run as-is, without any need for tweaking. This is good news, which leads me to think that HG2 will be released soon. It is possible that this could happen as early as the upcoming release (R2013b, 8.2) but I have a gut feeling that it will be in R2014a. I also have a gut feeling that MathWorks will name that release 9.0 rather than 8.3, in keeping with its arch-rival Mathematica.
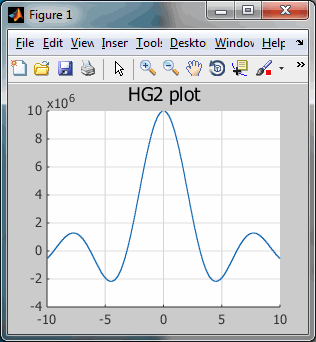
HG2 has improved grid lines, plot anti-aliasing and customizable everything (more on this below). Here’s a simple plot line as it appears in both HG1 and HG2:
hFig = figure('pos',[100,100,300,250]);
x = -10:0.1:10;
y = 1e7*sin(x)./x;
hLine = plot(x,y);
box off; grid on;
title('HG2 plot');
Clik here to view.
 Image may be NSFW.
Clik here to view.

Same plot in HG1 and HG2
We can see that MathWorks has invested heavily in improving usability. The graphics are now much more visually appealing than before. A lot of thought has gone into small details such as the plot colors and the axes gray shades. The changes are small when taken separately, but the overall gestalt is striking. HG2 will definitely justify my license maintenance cost.
Highly customizable
Matlab in HG2 mode acts and behaves pretty much as you would expect. There are no visible changes to the Desktop or the graphics interface. The major difference is that all graphics handles, whether interactive controls (figure, uicontrols, uitables, etc.) or graph elements (axes, lines, patches, etc.) are instances of class objects (e.g., matlab.ui.Figure or matlab.graphics.chart.primitive.Line) rather than numeric values. This makes it easy to issue commands such as:
hFig.Color = 'w';

hAxes = gca;
hAxes.Title.Color = 'm';  % default: [0,0,0] = black
hAxes.YRuler.SecondaryLabel.String = 'millions';  % original: 'x10^{6}'
hAxes.YRuler.SecondaryLabel.FontAngle = 'italic';  % default: 'normal'
hAxes.YRuler.Axle.LineStyle = 'dotted';  % default: 'solid'
hAxes.YRuler.Axle.ColorData = uint8([0,100,0,255])';  %=dark green; default: [51 51 51 255], corresponding to [0.2 0.2 0.2 1]
hAxes.YBaseline.Color = 'b';  % default: [0.2 0.2 0.2]
hAxes.YBaseline.Visible = 'on';  % default: 'off'
hAxes.XRuler.Axle.Visible = 'off';  % default: 'on'

hLine.Color = [1,0,0];  %='red'
rather than using the corresponding set(…) or get(…) functions, which are still supported for backward compatibility.
Clik here to view.

Customized HG2 plot
Notice how much more customizable HG2 is compared to HG1. I am pretty excited from the huge number of additional possible customizations in HG2 compared to HG1. It is real a pity that many of these customizations rely on hidden/undocumented properties (see below). Hopefully this will change when HG2 is officially released.
Some observations
Here are a few observations that I collected on the latest HG2, as reflected in R2013a:
- Java is still supported (hurray!). The warnings about the figure’s JavaFrame property becoming deprecated have fortunately not been fulfilled (hopefully never). All the Java-based GUI tricks shown on this blog and in my book still work, excluding some minor things here and there which are due to inter-release changes rather than to the new HG2 engine.
- In order to access the top-level Java
Frameof a figure window, we now need to usejavaFrame.fHG2Clientrather thanjavaFrame.fHG1Client. The relevant code should now look something like this, in order to be fully-compatible with older Matlab releases:jFrame = get(handle(hFig), 'JavaFrame'); try % This works up to R2011a jFrame.fFigureClient.setClientDockable(true); catch try % This works from R2008b and up, up to HG2 jFrame.fHG1Client.setClientDockable(true); catch % This works in HG2 jFrame.fHG2Client.setClientDockable(true); end end
- Anti-aliasing of plot elements (a.k.a. line -smoothing) is now ‘on’ by default (double hurray!). Apparently, MathWorks solved the problems with the existing undocumented LineSmoothing property. Still, for some unknown reason, LineSmoothing remains a hidden/undocumented property. Note that for some objects the property name is different. For example, the axes title (which is a text object of class
matlab.graphics.primitive.Text) has a new property called Smoothing that controls anti-aliasing (unlike LineSmoothing, Smoothing appears to be an un-hidden fully-documented property).
R2013b addendum: The figure handle now includes a property called GraphicsSmoothing that controls anti-aliasing at the entire figure level (default=’on’). No more need to set individual graphic elements, although we still can if we want (alas, this flexibility may be removed soon – see item #6 below). I would have liked to see the anti-aliasing feature use the same property name for all graphic elements, rather than GraphicsSmoothing/LineSmoothing/Smoothing, but maybe I’m just being an ungrateful spoil-sport… The good news about GraphicsSmoothing is that this is a non-hidden property. This means it can be seen with get(gcf) and once HG2 becomes live it will become fully documented/supported – hurray! - Many new properties have been added to graphic objects, that enable customization of different aspects. For example, we can customize the axes grid-lines, containing box and exponent labels in ways that were impossible in HG1 (triple hurray!). Note that many of these new properties are hidden/undocumented (why the hell for???), so we need a utility such as my uiinspect or getundoc to detect them. Some of the useful new axes properties include *Ruler, *Baseline, *GridHandle, BoxFrame and BackDrop (I showed an example usage of *Ruler and *Baseline above). I have absolutely no idea why these so-useful properties are kept hidden, it simply makes no sense.
- Some existing HG1 properties are missing. For example, the UserData property is no longer available for some Java objects (this is a real pity — I depended on it for many functionalities, such as storing node-specific data in uitree/
JTreenodes). Similarly, axes no longer have *LimInclude properties (this actually makes sense – these properties are still available in plot lines, where they actually have a use). - Some existing HG1 properties now issue a warning, although they still work. For example:
>> hAxes.DrawMode = 'fast';
Warning: The DrawMode property will be removed in a future release.
(Type "warning off MATLAB:hg:willberemoved" to suppress this warning.)

>> hLine.LineSmoothing
Warning: The LineSmoothing property will be removed in a future release.
(Type "warning off MATLAB:hg:willberemoved" to suppress this warning.)
ans =
on
R2013b addendum:
hAxes.DrawModeno longer issues a warning, althoughhLine.LineSmoothingdoes. - There is an open bug on R2012b and R2013a whereby the clf function does not delete javacomponent objects. This bug does not affect HG2, where clf works properly.
- Some GUI components are being placed a pixel or two sideways in HG2 compared to HG1. This has no visual importance except in very rare cases, but it does affect my findjobj utility, which relies on the component’s position to find its underlying Java object. I have updated findjobj for the upcoming HG2 and it should work with both HG1 and HG2.
- The default axes and labels color has changed from black to gray ([0.2 0.2 0.2]). Grid lines now use an even lighter gray shade. Visually I think that this is a great change, since it directs the viewer’s focus on the plot contents rather than the external decorations.
- The default axes plot color order has changed. The standard plot color is no longer blue (as it was for ages in Matlab), but a bluish tint; the second color is no longer red but light green; the third color is reddish rather than dark green, etc.:
% HG1
>> get(0,'defaultAxesColorOrder')
ans =
            0            0            1
            0          0.5            0
            1            0            0
            0         0.75         0.75
         0.75            0         0.75
         0.75         0.75            0
         0.25         0.25         0.25

%HG2
>> get(0,'defaultAxesColorOrder')
ans =
     0.070588      0.40784      0.70196
      0.92941      0.14118      0.14902
      0.60784       0.7451      0.23922
      0.48235      0.17647       0.4549
            1      0.78039            0
      0.30196       0.7451      0.93333
      0.82353       0.4549            0
R2013b addendum: The default colors have changed a bit (for the better I think). I still think that the relative order should more closely match the current order (blue-green-red-etc.), for compatibility with existing apps. A small utility function could be added that modifies the color-order to something that may be better suited for color-differentiation (see Tim Holy’s excellent utility for an example).
- HG2 axes no longer forget the previous plot color (unless we used hold all) — in HG2 color cycling is on by default. Note that this causes some visual discrepancies between HG1 and HG2 in plots that use hold on and have multiple plot lines: In HG1 they were all blue; in HG2 the first is bluish, the second is greenish, then reddish etc.
- GUIDE is still the same-ol’ GUIDE (sigh!). The figure toolbar and menubar have likewise not been upgraded, as far as I could tell.
- HG2 performance appears to be generally slower than HG1. Hopefully this will improve by the time HG2 is released, since performance has been one of HG1′s drawbacks all along. In my tests, most GUI/graphic aspects ran only slightly slower in HG2, except for 2D plots that were significantly slower. This is corroborated by running bench: on my computer, HG1 yields 0.4 for 2D and 0.22 for 3D; in HG2 the performance is 2.1 for 2D and 0.18 for 3D. Looks like the 2D performance still needs some work…
Testing HG2
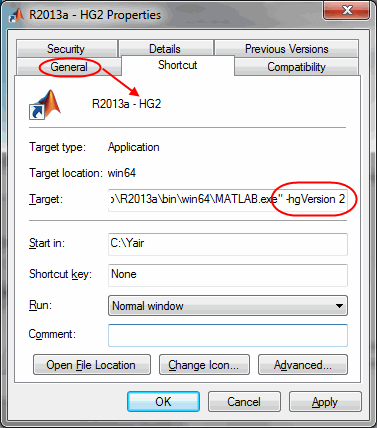
As noted in my original article, we can start Matlab in HG2 mode by simply adding the startup (command-line) switch -hgVersion 2 to the Matlab command (note the space between the -hgVersion and the “2″). For example, in Windows, all you need to do is to copy your Matlab shortcut sideways (so that you will always have the standard HG1 version available), then right-click the shortcut, select “Properties”, then add -hgVersion 2 to the Target field (note the space between “hgVersion” and “2″). You will probably want to also add the “HG2″ descriptor to the shortcut name, in the “General” tab:
Clik here to view.

Matlab startup switch for HG2
If you have any Matlab application that relies on GUI or graphics, I urge you to test it on the new HG2 system. It’s trivially simple and your application should work exactly the same, or better. If you do detect some incompatibility, please post a comment or shoot me an email. In due course I expect that MathWorks will open an official channel for this, but in the meantime I’ll be sure to pass the information to the relevant person.
Do take a moment for testing HG2 – we can all contribute to ensure that when HG2 does come out it will be perfect. It’s in our interest.
NYC visit
If you happen to be in New York next week, I urge you to attend the MATLAB Computational Conference on Thursday May 23 (free registration; my presentation is scheduled for 4:50pm). I would be happy to meet you to discuss how I could bring value to your needs, either financial-oriented or not. We could meet at the conference, or anywhere in New York on Wednesday May 22 or Friday May 24.
Clik here to view.

Related posts:
- Plot LimInclude properties The plot objects' XLimInclude, YLimInclude, ZLimInclude, ALimInclude and CLimInclude properties are an important feature, that has both functional and performance implications....
- FIG files format FIG files are actually MAT files in disguise. This article explains how this can be useful in Matlab applications....
- Panel-level uicontrols Matlab's uipanel contains a hidden handle to the title label, which can be modified into a checkbox or radio-button control...
- Performance: accessing handle properties Handle object property access (get/set) performance can be significantly improved using dot-notation. ...